FIGURE 4.
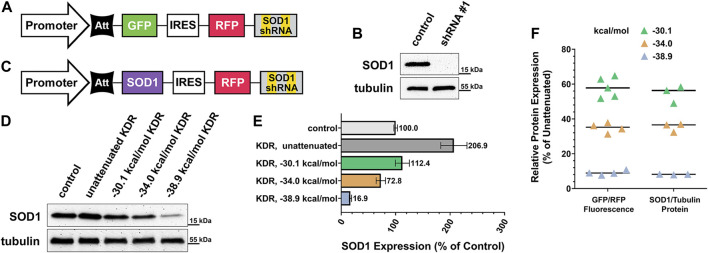
Practical application of knockdown-replacement strategy using pKDR-SOD1 virus. (A) SOD1 gene specific shRNA potency was validated using lentivirus carrying SOD1 shRNA, but GFP coding sequence in rescue position rather than SOD1. (B) Cell lines were created using SOD1-KD virus as previously described, then evaluated by western blot. Comparison of KD condition (equivalent to background noise) to un-transduced control HEKs confirms complete shRNA efficacy. (C) GFP gene was then exchanged for SOD1 and a range of graded-expression constructs were created, this included un-attenuated rescue expression (no hairpin) and three levels of increasing attenuator potency (−30.1, −34.0, and −38.9 kcal/mol). (D) Cell lines were created for each of these 4 conditions, then SOD1 expression was evaluated by western blot and quantified in (E). Un-attenuated SOD1 expression was found to be over twice as high as baseline expression, whereas the −30.1 kcal/mol construct most closely matched endogenous expression. (F) Plasmid-based ratio of GFP “rescue”/RFP internal control fluorescence to virally expressed SOD1 rescue/endogenous tubulin protein is functionally identical for each attenuator tested. At −30.1 kcal/mol mean GFP expression was 58.05% of control, SEM ±2.58, 95% CI ± 5.05%, and SOD1 mean = 54.56%, SEM ±2.85. At −34 kcal/mol mean GFP expression was 34.91%, SEM = 1.40, 95% CI ± 2.74%, and SOD1 mean = 35.27%, SEM ±1.46. At −38.9 kcal/mol mean GFP expression was 9.10%, SEM ±0.64, 95% CI ± 1.25%, and SOD1 mean = 8.14%, SEM ±0.11. Means for each SOD1 attenuation condition fall within the 95% confidence interval of their corresponding plasmid-based in vitro measurement.

