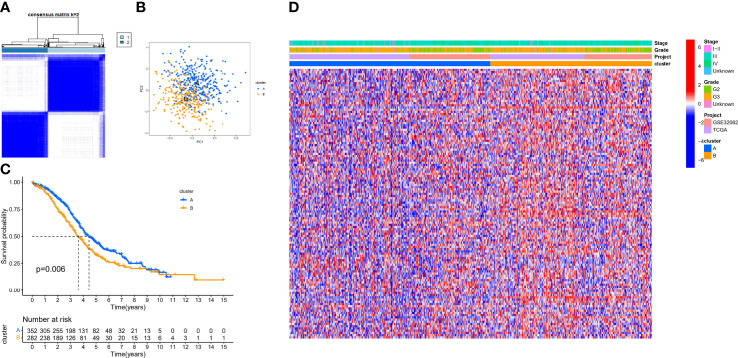
Figure 3.
The different hypoxia patterns in patients with OC. (A) Heat map of unsupervised clustering analysis. (B) Principal component analysis (PCA) analysis of different hypoxia patterns. (C) Kaplan–Meier analysis of overall survival time in different hypoxia patterns. (D) Heat map of the distribution of clinicopathological characteristics and two hypoxia patterns.

