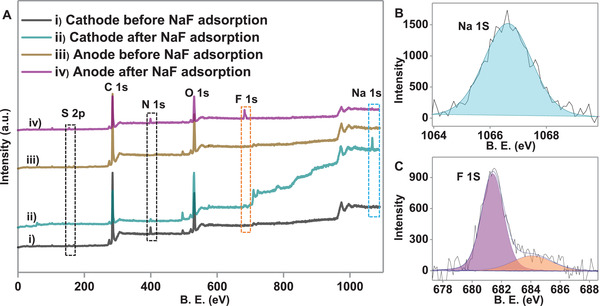
Figure 4.

A) XPS survey spectra of the material after single‐stage adsorption on i) cathode and iii) anode (before adsorption); ii) cathode and iv) anode (after NaF adsorption), B) and C) are the deconvoluted XPS spectra of Na 1s (light blue) and F 1s (pink@681.4 eV and orange color@684.5 eV) for cathode and anode, respectively after NaF adsorption.
