
Figure 3. Multifocal electroretinography.
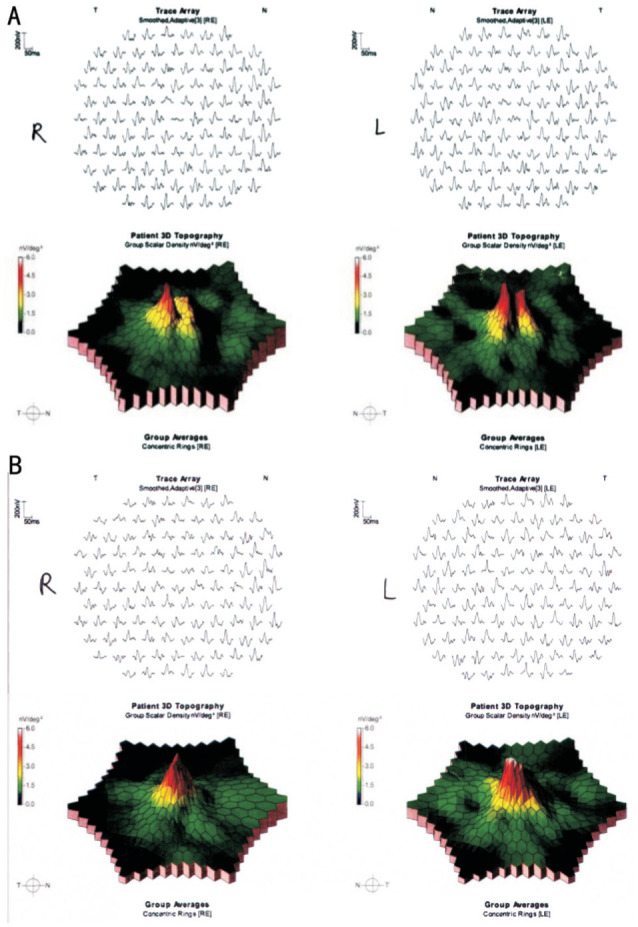
A: The three-dimensional topography of mfERG demonstrates a subnormal central region and the ERG traces of fovea were low; B: mfERG amplitudes were improved 2mo after poppers cessation for both central responses, obviously in the right eye.