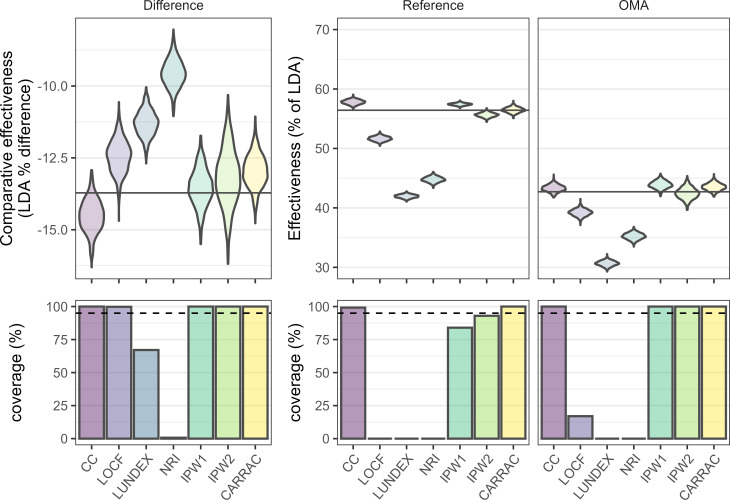
Figure 1.
Distribution of the effectiveness measured by the low disease activity (LDA) proportion (upper panels) and the associated coverage (percentage of CIs in the simulation samples which include the true value, lower panels) for each treatment (reference and another mode of action (OMA)—other modes of action, middle and right panels) and for the difference between the treatments (difference, left panels). The methods analysed are complete case analysis (CC), last observation carried forward (LOCF), LUNDEX, non-responder imputation (NRI), inverse probability weighting accounting for the reasons for treatment cessation in the attrition weights (IPW2) or not (IPW1), and confounder-adjusted response rate with attrition correction by reason for drug cessation (CARRAC). The widths of the violins are fixed, so the area of the violin does not represent the number of counts. The true value is represented as a black horizontal line.

