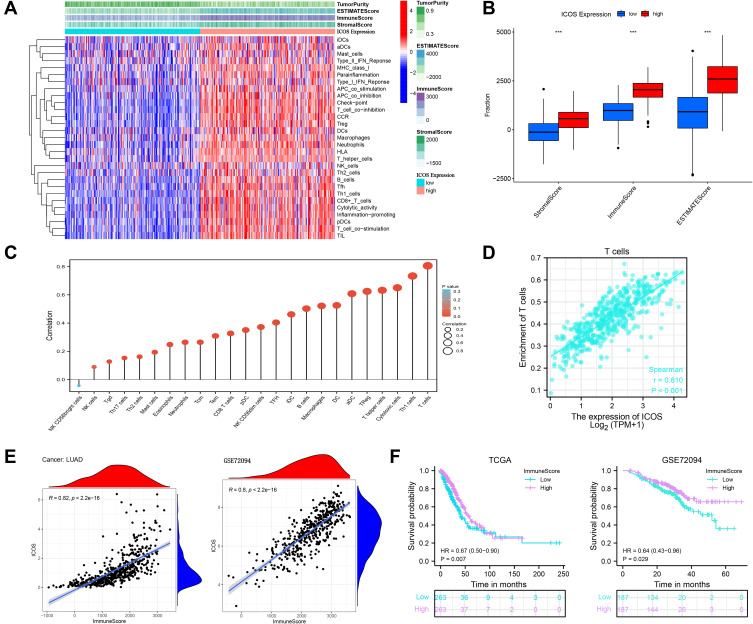
Figure 6.
Relationship between ICOS and tumor microenvironment in LUAD. (A and B) Analysis of the relationship between ICOS and tumor microenvironment in LUAD. (C) Correlation analysis of ICOS with related 24 immune cells in LUAD. (D) Correlation between ICOS and T cells in LUAD. (E) Correlation analysis of ICOS expression with immune scores in LUAD samples in TCGA-LUAD and GSE72094 datasets.(F) Correlation of ICOS0 expression levels with overall patient survival time in TCGA-LUAD and GSE72094 datasets.

