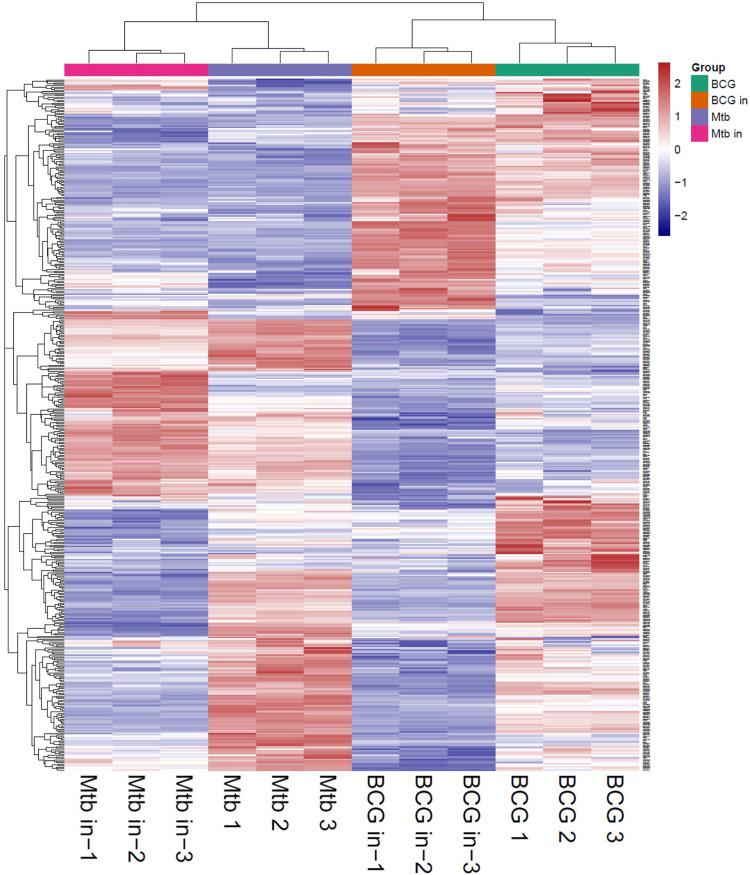
FIGURE 3.
Heatmap of all groups (M.tb, intracellular M.tb, BCG, and intracellular BCG). Heatmap of proteins differentially expressed in all groups. Blue-to-red scale indicates low-to-high proteins expression levels. Differentially expressed proteins were defined based on a threshold fold change >1.5, at p < 0.05.

