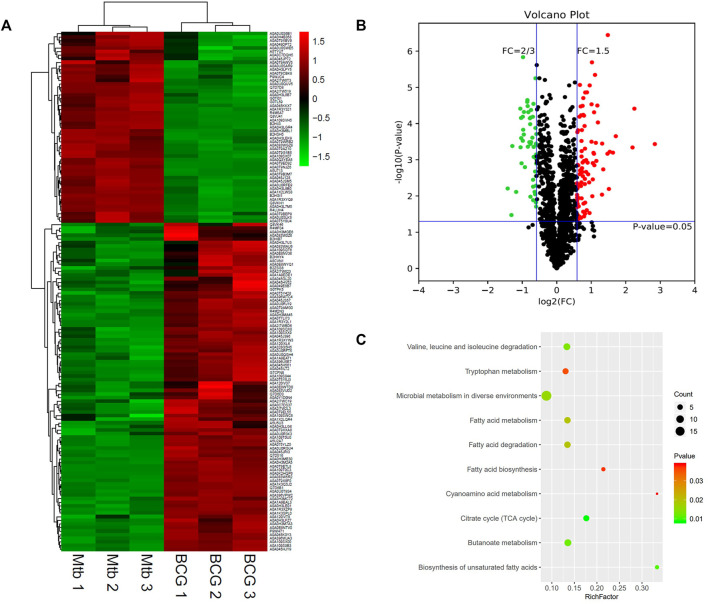
FIGURE 5.
Differential protein profile between M.tb and BCG. (A) Heatmap of proteins differentially expressed between the group of M.tb and BCG. Green-to-red scale indicates low-to-high proteins expression levels (p < 0.05). (B) Volcano plots of proteins differentially expressed between the group of M.tb and BCG. The red dots on the right indicate the significantly upregulated proteins, whereas the downregulated proteins are shown with green dots on the left. Differentially expressed proteins were defined based on a threshold fold change >1.5, at p < 0.05. (C) The top 10 KEGG pathways enriched for the significantly differentially expressed proteins. Entries with larger bubbles contain more differential genes. The color of the bubbles indicates the p value. The smaller the enrichment p value means the greater the degree of significance (p < 0.05).

