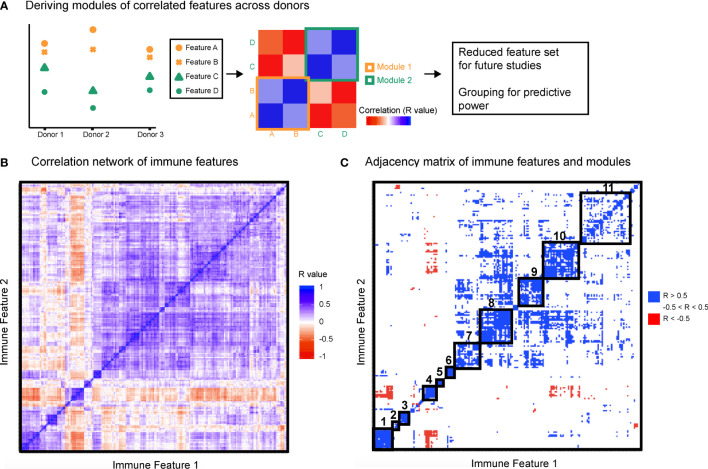
Figure 2.
Immune variation enables detection of response modules predominantly defined by signaling proteins. All features were correlated with one another across donors. (A) Highly correlated features were identified and annotated as groups of correlated features, or modules. (B) Clustered correlation heat map of the 199 features. Immune features were clustered on each axis based on similarity of correlation coefficient (R-value). Heat map is colored by R-value. (C) R-values were binned yielding an adjacency matrix. R-values from -1 to -0.5 are red, R-values from -0.5 to 0.5 are white, and R-values from 0.5 to 1 are blue. Modules were drawn based on visualized groups of highly correlated features (black boxes).

