Figure 4.
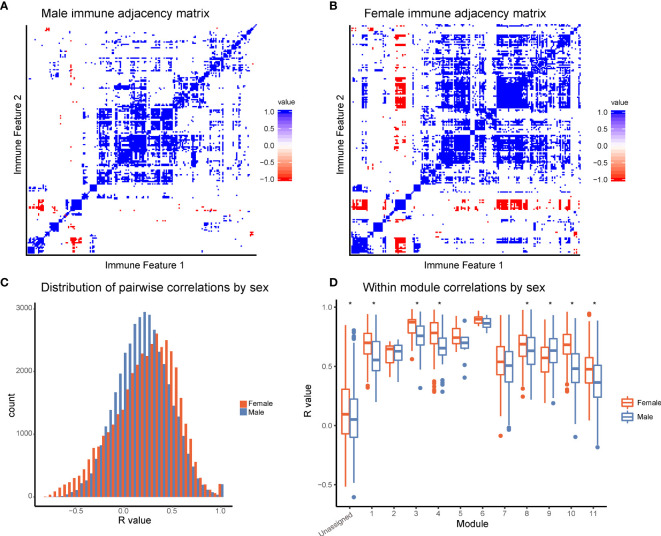
Females have increased coordination of immune cell signaling capacity. (A) Adjacency matrices of 199 immune features across male donors. R-values were binned; R-values from -1 to -0.5 are red, from -0.5 to 0.5 are white, and from 0.5 to 1 are blue. Feature order was set by the clustering order on the full dataset. (B) Adjacency matrices of 199 immune features across female donors. R-values were binned; R-values from -1 to -0.5 are red, from -0.5 to 0.5 are white, and from 0.5 to 1 are blue. Feature order was set by the clustering order on the full dataset. (C) Distribution of correlation coefficients (R-values) of each pairwise feature in male donors (turquoise) compared to female donors (pink). Distributions were significantly different (p-value = 2.2x10⁻¹⁶, Wilcoxon sum-rank test). (D) Box-plots of correlation coefficients (R-values) within modules grouped by sex. Modules are numbered as in Figure 2C . Females (pink) had higher levels of correlation in modules 1, 3, 4, 8, 10, 11, and unassigned (Wilcoxon sum-rank test, adjusted p-value <.05). Males (turquoise) had higher levels of correlation in module 9. (* indicates Wilcoxon sum-rank test adjusted p-value <.05).

