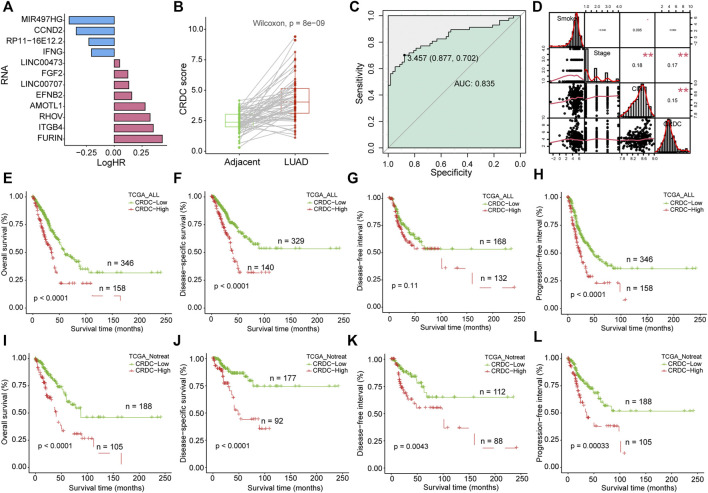
FIGURE 4.
Formulation of the CRDC risk score and prognostic analysis. (A) Barplot depicted the log-transformed hazard ratio of CRDC genes in the univariate Cox regression model. (B) Boxplot for CRDC of LUAD and adjacent paired samples. The green column indicated adjacent samples, and the red column indicated LUAD tissues. (C) ROC curve of CRDC in discriminating LUAD patients from adjacent control samples. The green color indicated AUC. (D) Spearman correlation analysis of smoking, clinical stage, CIN, and CRDC risk score. Kaplan–Meier survival curves of the CRDC risk score in (E–H) all LUAD patients (TCGA_ALL, for short) and (I–L) patients without postoperative treatment (TCGA_Notreat, for short).

