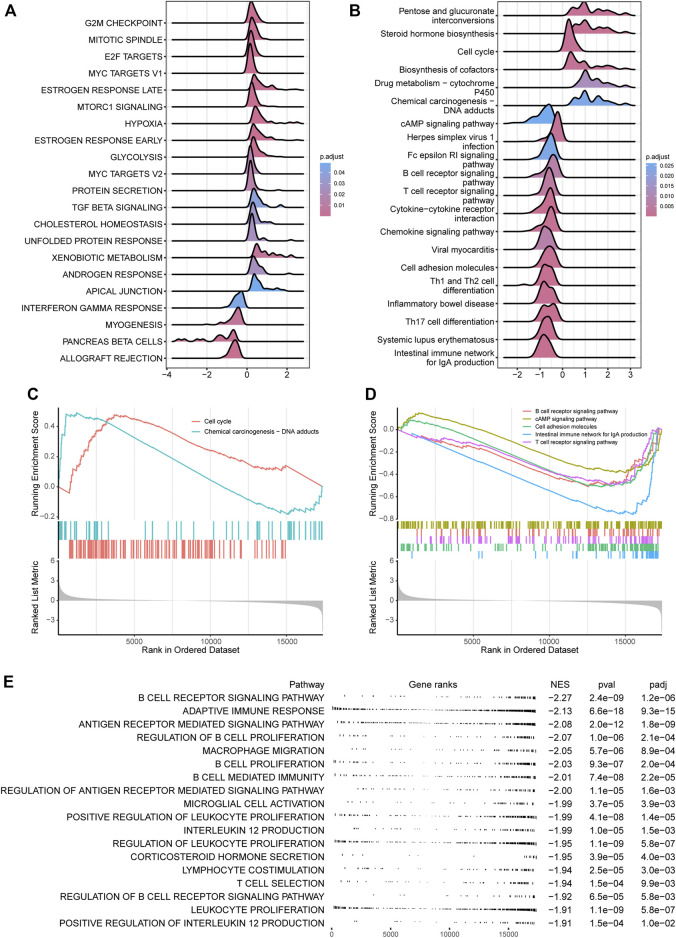
FIGURE 6.
CRDC relevant functional analysis. Ridgeline plots for log2FC (CRDC-High versus CRDC-Low) distribution of core-enriched genes in (A) hallmarks and (B) KEGG pathways based on the GSEA method. GSEA plots for (C) positive and (D) negative KEGG pathways associated with CRDC. (E) Table of the CRDC-related negative GO (BP) enrichment graph.

