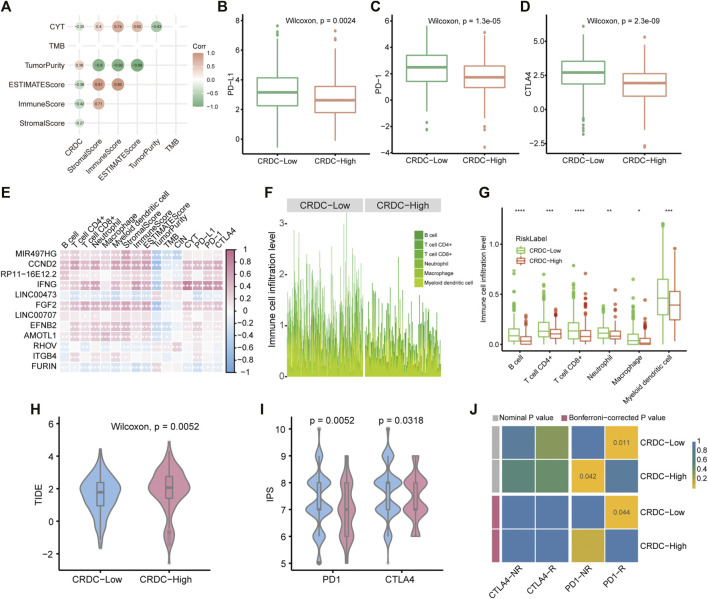
FIGURE 7.
CRDC-related immune infiltration characteristics. (A) Spearman correlation analysis plot of the correlativity of the CRDC score, StromalScore, ImmuneScore, ESTIMATEScore, TumorPurity, TMB, and CYT. Boxplots described the expression difference of (B) PD-L1, (C) PD-1, and (D) CTLA4 between CRDC-High and CRDC-Low samples. (E) Spearman correlation heatmap of CRDC genes and immune microenvironment cell infiltration, StromalScore, ImmuneScore, ESTIMATEScore, TumorPurity, TMB, CIN, CYT, PD-L1, PD-1, and CTLA4. (F,G) Immune microenvironment cell infiltration level in CRDC-High and CRDC-Low samples. The violin plots displayed the TIDE (H) and IPS (I) scores between CRDC-High and -Low groups. (J) Heatmap of comparison and identification of common subtypes between groups divided by CRDC risk and response for ICB therapy. NR and R represented not respond and respond to immunotherapy, respectively.

