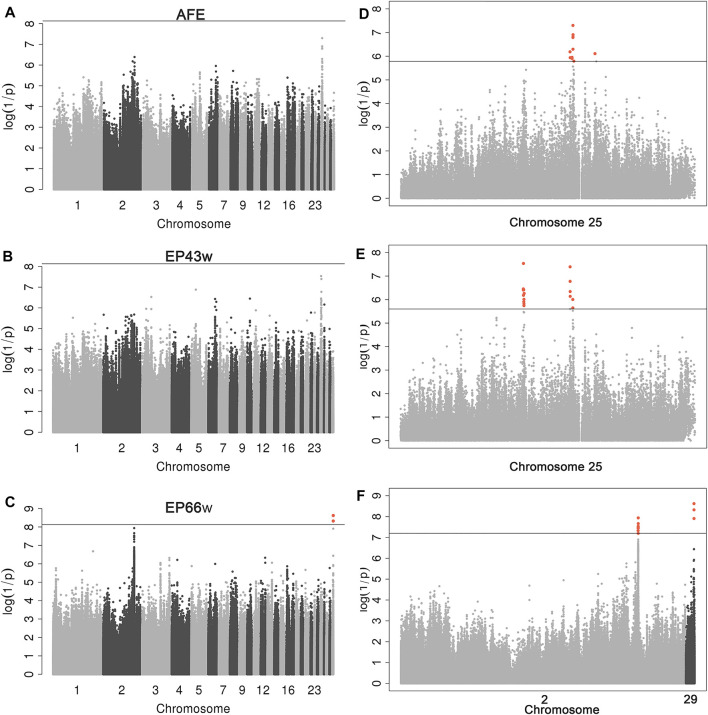
FIGURE 1.
Manhattan plots derived from GWASs for AFE, EP43w, and EP66w. Each dot on this figure corresponds to a SNP within the dataset, while the y-axis and x-axis represent the negative log10 p-value of the SNPs and the genomic positions separated by chromosomes, respectively. Black solid lines in panels A–C indicate the 5% genome-wide Bonferroni-corrected threshold; the tomato puree points represent SNPs that exceeded the chromosome-wide significance threshold. Black solid lines in panels D–F indicate the genome-wide FDR-corrected threshold; the tomato puree points represent SNPs that exceeded this threshold. GWASs, genome-wide association studies; AFE, age at first egg; EP43w, egg production at 43 weeks; EP66w, egg production at 66 weeks; SNP, single-nucleotide polymorphism; FDR, false discovery rate.

