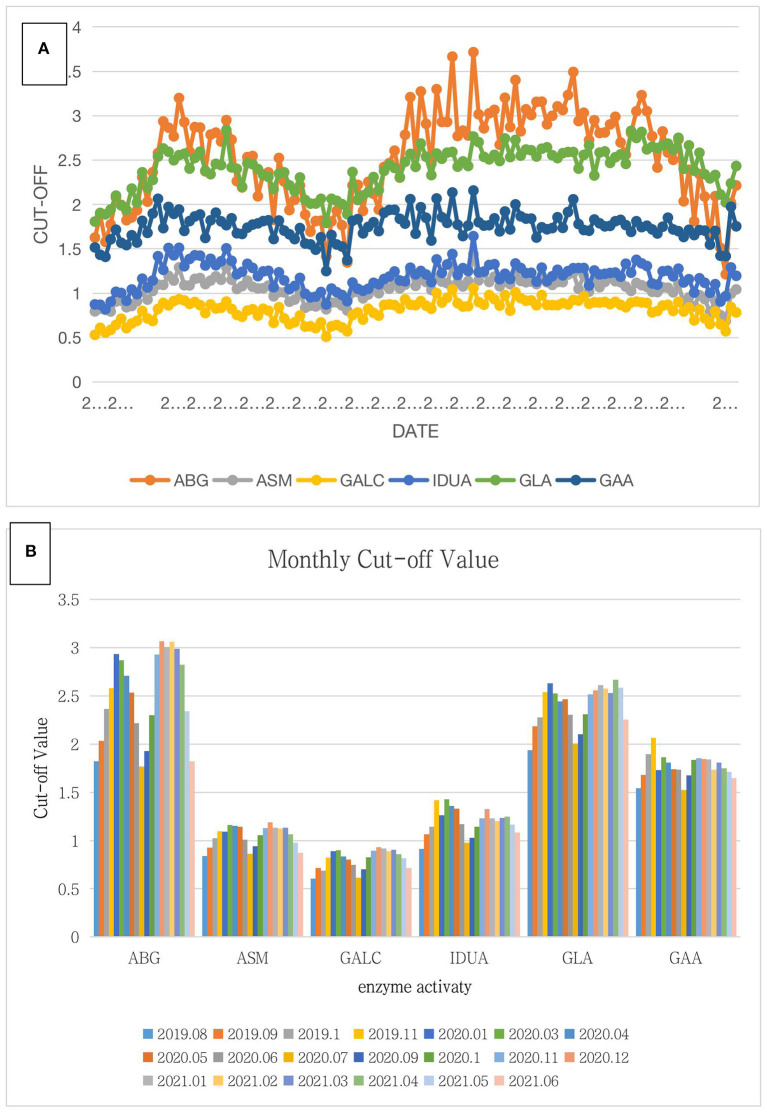
Figure 1.
Summary of the cutoff value for 38,945 screening samples. (A) In this chart, the abscissa is the date of the experiment, and the ordinate is the cutoff value of six lysosomal enzymes. The orange, gray, yellow, blue, green, and navy blue lines represent ABG, ASM, GALC, IDUA, GLA, and GAA, respectively. The overall trend of the six lysosomal enzymes was first an increase and then a decrease followed by another increase, finally showing a downward trend. Among them, the increasing trends of ABG and GLA were obvious though the changes in ASM, IDUA, GAA, and GALC were not significant. (B) In this chart, the abscissa is six lysosomal enzymes, and the ordinate is the average monthly cutoff value. Differently colored bars represent different months. For all six lysosomal enzymes, the average cutoff values were the lowest in July and highest in November, December, January, or February.

