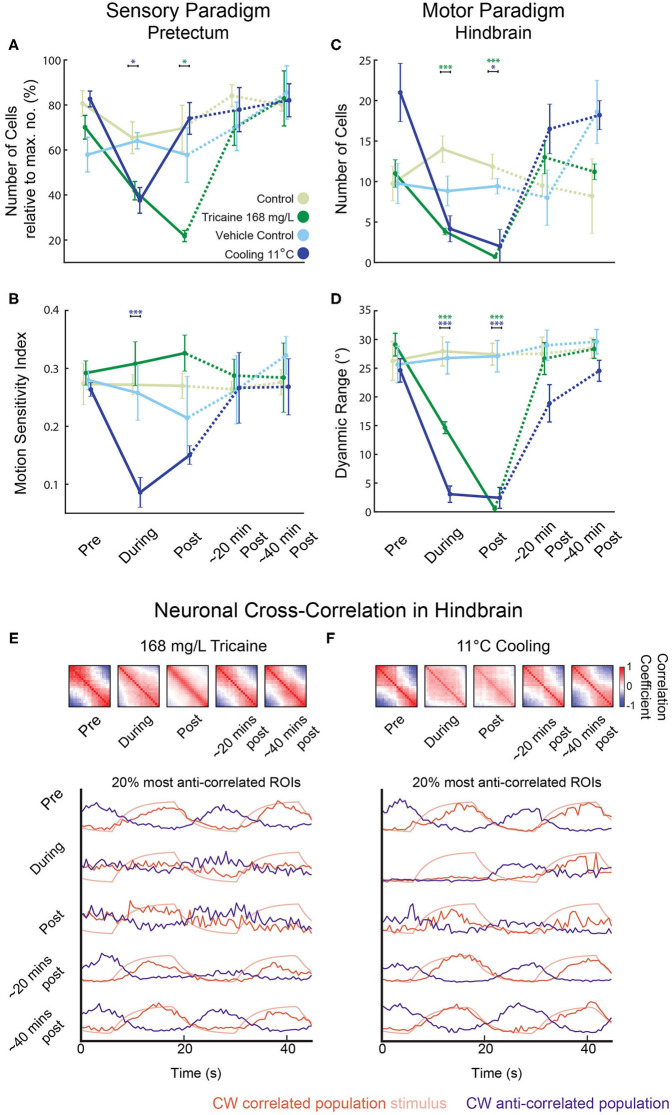
Figure 6.
Reduced sensorimotor activity in pretectum and hindbrain after application of tricaine and gradual cooling anesthesia. (A–D) Summary of the results from Figure 5 highlighting the main treatment effects on the number of identified cells in the pretectum (A), the motion-sensitivity index of remaining pretectal neurons (B), the number of identified cells in the hindbrain (C), and the dynamic range of eye movements observed (D). In (A), the number of remaining motion-sensitive neurons relative to the maximal number of motion-sensitive neurons detected in the recording is quantified. Results were binned per phase into baseline, treated, recovery, recording 2 and recording 3 and analyzed via two-way repeated measures ANOVA with Tukey's HSD test, n = 4–7. *p < 0.05, ***p < 0.001. (E,F) Top: Pair-wise neuronal cross-correlation matrices for the hindbrain of larvae treated with 168 mg/L tricaine or cooled to 11°C. y and x axes of each matrix correspond to the neuronal ROIs sorted according to their individual correlation to the clockwise stimulus. Cross-correlation matrices were calculated for the five different time periods shown and in each displayed matrix, the matrices of all individual recordings and larvae were averaged (a weighted average that took into account the number of ROIs per recording). Bottom: The 20% most correlated (positively or negatively) ROIs are shown. Stimulus traces show expected activity of a CW stimulus-correlated ROI (i.e., the kinetics-adjusted stimulus regressor see Methods).

