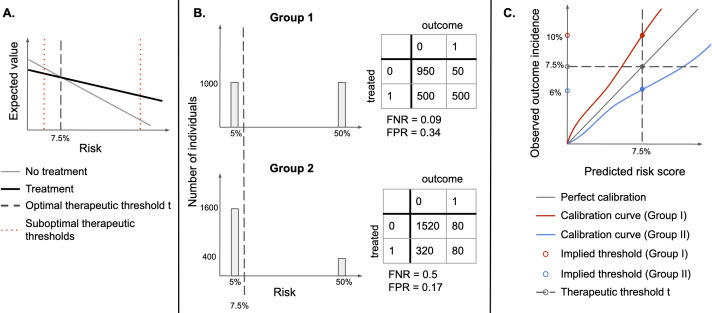
Figure 1.
(A) Identifying an optimal therapeutic threshold. An individual with risk r should be treated if the expected value of treatment exceeds that of non-treatment. As risk increases, the benefits of treatment become more significant, and assigning treatment becomes more optimal than withholding it. The optimal therapeutic threshold t is the value of risk at which treatment and non-treatment have the same expected value (the indifference point)—for individuals with r>t, treatment is expected to be more beneficial than non-treatment. Setting a non-optimal therapeutic threshold could lead to suboptimal treatment decisions for some individuals (treating some individuals for whom non-treatment has a higher expected value, or not treating individuals for whom treatment has a higher expected value). (B) Illustration of the sensitivity of FPR and FNR to the distribution of risk. Assume that there are two types of easily distinguishable individuals: with 5% and 50% chance of developing a disease, respectively, and there are two groups composed of both types of individuals, but one has a higher proportion of lower-risk individuals. If the same therapeutic threshold is applied to both groups, false positive rates (FPR) and false negative rates (FNR) will not be equal, even though we would be making optimal treatment decisions for each patient, in both populations. (C) Under miscalibration, implied thresholds differ from therapeutic thresholds. If risk scores are miscalibrated, taking action at the threshold of 7.5% corresponds to different observed outcome rates in the two groups. For Group I, a risk score of 7.5% corresponds to an observed outcome incidence of 10%, while for Group II it corresponds to 6%, therefore, individuals in Group II would be treated at a lower risk than individuals in Group I.

