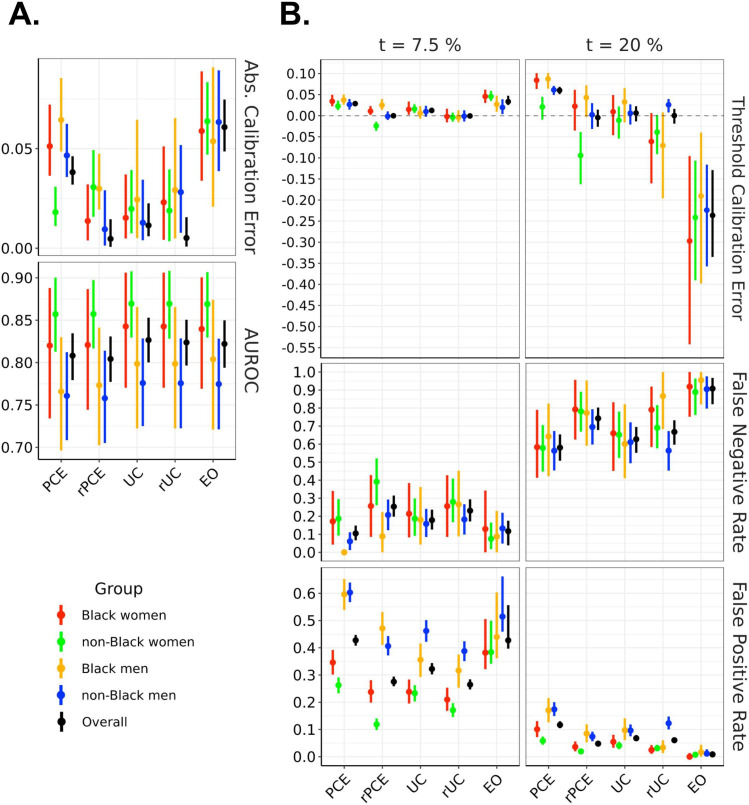
Figure 3.
Model performance across evaluation metrics, stratified by demographic group, evaluated on the test set. The left panel showsAUROC and absolute calibration error. The right panel shows false negative rates, false positive rates and threshold calibration error at two therapeutic thresholds (7.5% and 20%). EO, equalised odds; PCEs, original pooled cohort equations; rPCE, revised PCEs; rUC, recalibrated model; UC, unconstrained model.

