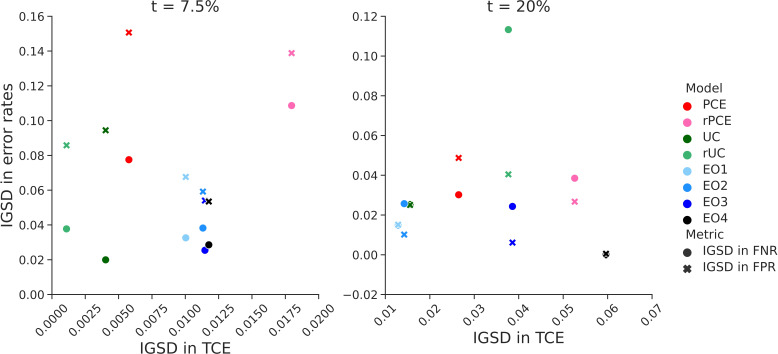
Figure 4.
Relationship between intergroup variability in threshold calibration rate (TCE) and error rates. The figure shows the relationship between intergroup SD (IGSD) of threshold calibration error (on the x-axis) and IGSD of false negative rate (FNR, circles) and false positive rate (FPR, crosses) across the models: EO1–4, equalised odds with increasing values of λ. The EO3 corresponds to the EO model discussed in the Results section. In the models we trained, IGSD of TCE scales inversely with the IGSD of FNR and FPR. PCE, original pooled cohort equations; rPCE, revised PCEs; rUC, recalibrated model; UC, unconstrained model.

