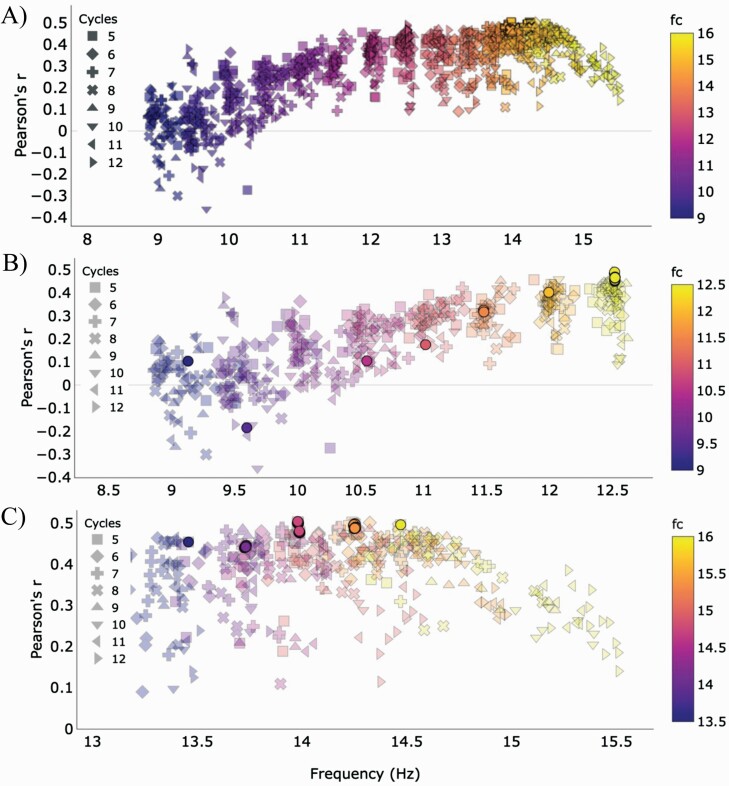
Figure 5.
Model performance, defined by Pearson’s r, for the different parameter combinations by central frequency (fc) and cycles. (A) Scatter plot of all parameter combinations with single fc value (N = 1495) shows that predicting cognition improves with higher central frequencies. (B) Scatter plot for slow spindle models (N = 610) shows that model performance peaks for slow spindles when the cycles parameter is set to 12 and central frequency (fc) is 12.5 Hz. Threshold > 4.5 and minimum spindle duration<0.5 s. (C). Scatter plot for fast spindle models (N = 818) shows good performance over 14 Hz that peaks when central frequency (fc) is 15–15.5 Hz and the cycles parameter is set to 5. Opaque circles represent threshold > 4.5 and minimum spindle duration < 0.5 s and cycles of 12 for (B) and 5 for (C).

