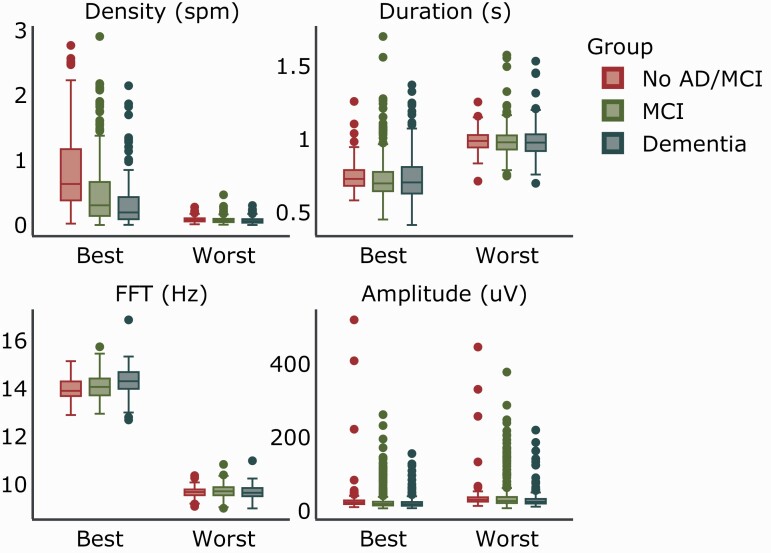
Figure 7.
Distribution of spindle features by cognitive status for best and worst parameter combinations.
Box plot of spindle density, duration, mean frequency (FFT), and amplitude are shown for each group and combination. The box signifies the upper and lower quartiles. The median is represented by a short line within the box for each group. Outliers are depicted by dots. AD, Alzheimer’s Disease; MCI, Mild Cognitive Impairment.

