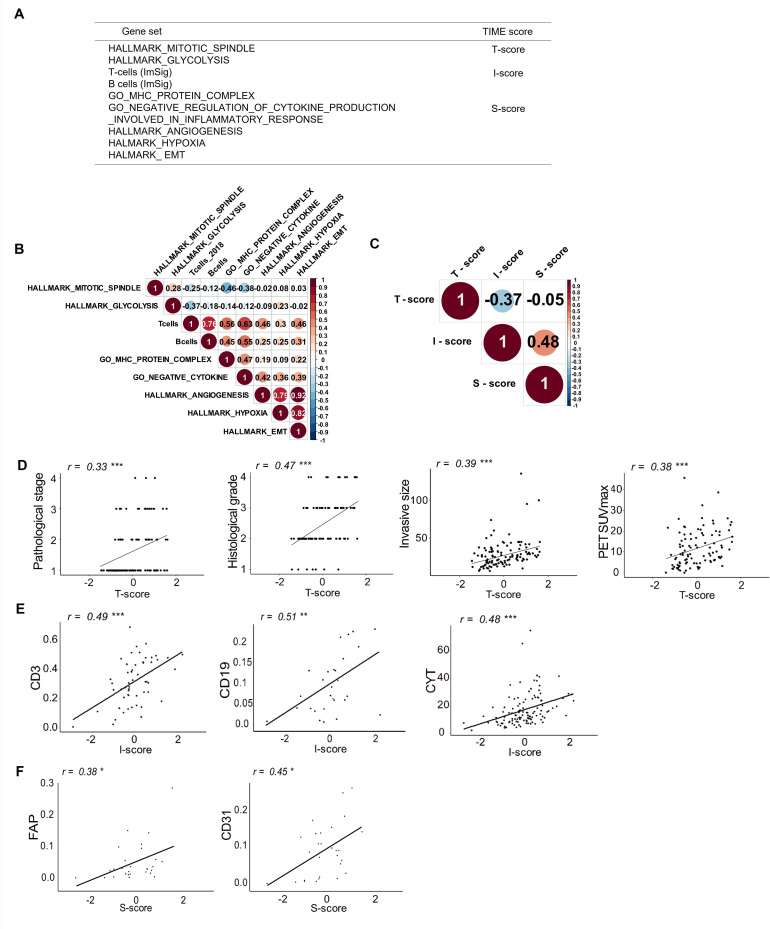
Figure 1.
TIME scoring using RNA sequencing data and associations with clinical features and experimental data in patients with lung cancer. (A) Gene sets and TIME scores used in this study. (B) Correlogram showing correlations between each gene signature of the TIME factors in the Aichi Cancer Center (ACC) cohort. The size of the circles indicates the degree of correlation. (C) Correlogram showing correlations between each TIME score (T-score, I-score and S-score) in the ACC cohort. Association of clinicopathological findings or experimental data with T-score (D), I-score (E) and S-score (F) are shown. CYT, cytolytic activity; epithelial‐mesenchymal transition; FAP, fibroblast activation protein; PET, positron emission tomography; SUVmax, maximum standardized uptake value; TCGA, The Cancer Genome Atlas; TIME, tumor immune microenvironment. *p<0.05; **p<0.01; ***p<0.001.

