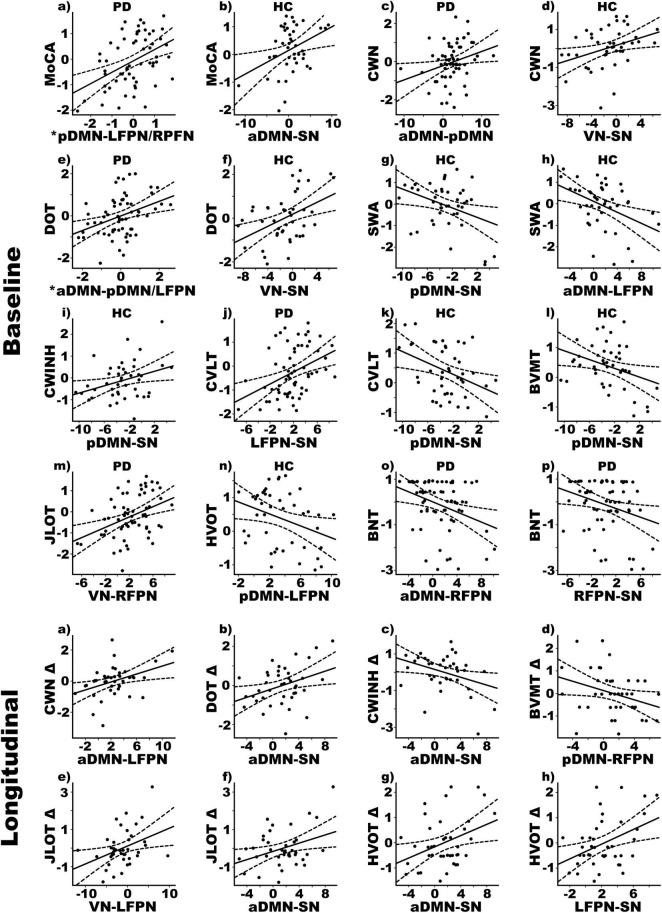
FIGURE 2.
Relationships between cognition and internetwork coupling topologies in PD and healthy control (HC) groups. Scatterplots display the best-fitting linear regression line (solid line) and 95% conference intervals (dotted lines) for significant correlations between age adjusted cognitive measures (y-axis) and internetwork connectivity topologies (x-axis). Top four rows show relationships with baseline cognitive functioning. Bottom two rows show relationships with 2-year changes in cognition, calculated using age-adjusted simple discrepancy scores designated by Δ (score at time 1—score at time 2). Positive discrepancy scores signify cognitive decline at the follow-up visit, except for the CWINH for which negative discrepancy scores signify cognitive decline. *Predicted values from the regression of internetwork connectivity onto MoCA scores are plotted for pDMN-LFPN and pDMN-RFPN couplings [Σ intercept + (betapDMN–LFPN * pDMN-LFPN score) + (betapDMN–RFPN * pDMN-RFPN score) = Σ–0.33 + (0.08 * pDMN-LFPN score) + (0.10 * pDMN-RFPN score)]. For DOT scores, predicted values are plotted for aDMN-pDMN and aDMN-LFPN couplings [Σ intercept + (betaaDMN–pDMN * aDMN-pDMN score) + (betaaDMN–LFPN * aDMN-LFPN score) = Σ–0.34 + (0.09 * aDMN-pDMN score) + (0.06 * aDMN-LFPN score)]. BNT, Boston Naming Test; BVMT, Brief Visuospatial Memory Test; CVLT, California Verbal Learning Test; CWINH, Color-Word Inhibition; CWN, Color Word Naming; DOT, Adaptive Digit Ordering; HVOT, Hooper Visual Organization Test; JLOT, Judgment of Line Orientation; MoCA, Montreal Cognitive Assessment; SWA, Category Switching.

