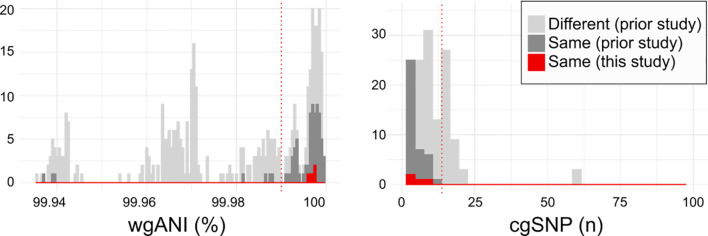
Figure 3.
Relatedness of serogroup 11 isolates from current and prior studies. Histograms depicting the pairwise whole genome average nucleotide identity (wgANI, left panel) and core genome single nucleotide polymorphism distance (cgSNP, right panel) values between isolates obtained from different individuals (light gray), from the same individual in prior studies (dark gray) and the same individual in the current study (red). Dotted lines depict clonality cutoffs empirically-derived according to value distribution. For clarity, only extreme values are depicted.

