Figure 5.
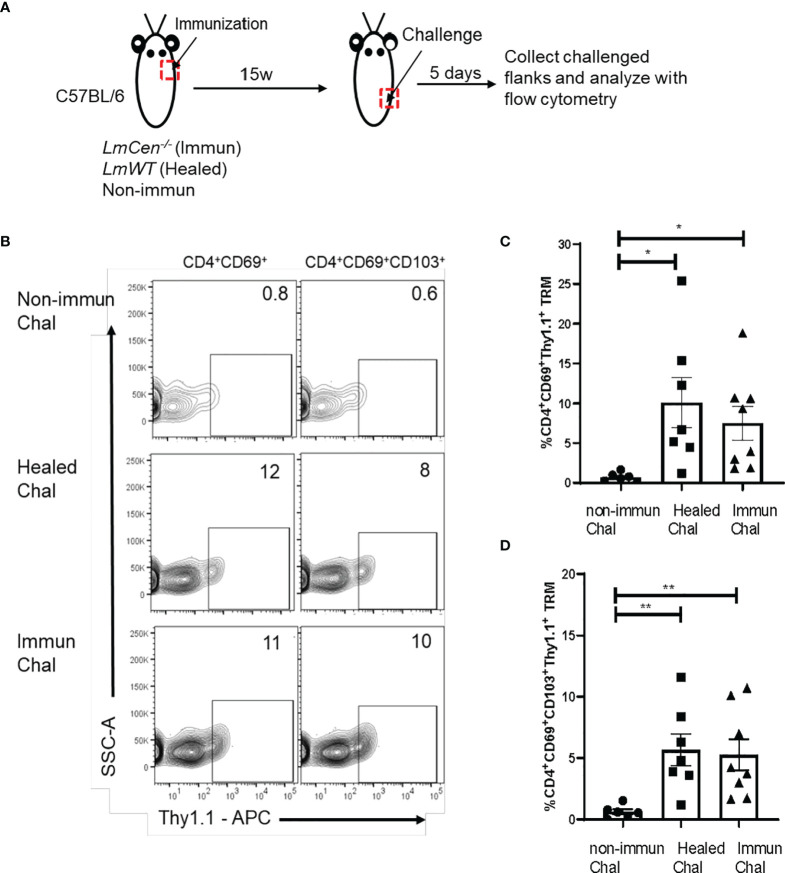
Skin TRM cells from LmCen-/– immunized mice produce IFNγ in response to challenge. Non-immunized, healed, and immunized IFNγ/Thy1.1 mice were challenged with LmWT parasite in the flank skin. T cells from challenged skin were isolated 5 days post-challenge, and cytokine production was assessed with flow cytometry analysis. (A) Schematic representation of the experiment. (B) Graph is representative of Thy1.1 staining on skin CD4+ TRM cells (CD3+CD4+CD44+CD62L-CD69+ and CD3+CD4+CD44+CD62L-CD69+CD103+). (C, D) Expression of Thy1.1 surface marker, representing IFNγ expression, was measured on (C) CD4+CD69+ and (D) CD4+CD69+CD103+ TRM cells. Y axis represents a portion of skin CD4+ TRM cells expressing IFNγ as a percentage of CD4+CD69+ TRM population. Data shown are combined results from two independent experiments with n = 6–8 mice per group. Bars represent the means with SEM in each group. Statistical analysis was performed by unpaired two-tailed t-test (**p < 0.007, *p < 0.02). Chal, Challenged; w, week.

