Figure 5.
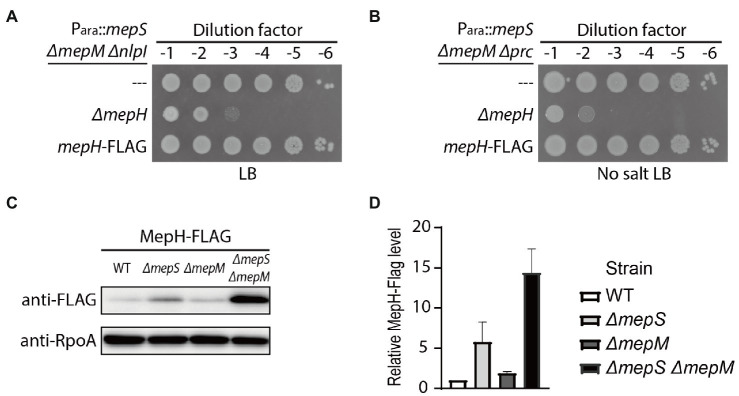
MepH levels increase in the ΔmepS ΔmepM strain. (A,B) Spot dilution assay to assess the functionality of MepH-FLAG. (A) The growth phenotype of WJ126 (Para::mepS ΔmepM ΔnlpI mepH-FLAG) was compared with that of WJ76 (Para::mepS ΔmepM ΔnlpI) and WJ95 (Para::mepS ΔmepM ΔnlpI ΔmepH) by incubation on LB agar for 22 h at 30°C. (B) The growth phenotype of WJ125 (Para::mepS ΔmepM Δprc mepH-FLAG) was compared with that of WJ81 (Para::mepS ΔmepM Δprc) and WJ89 (Para::mepS ΔmepM Δprc ΔmepH) by incubation on LB agar lacking salt for 22 h at 30°C. (C) MepH-FLAG levels in the ΔmepS and ΔmepM mutants. Strains with MepH tagged with 3X FLAG at the native chromosomal locus, WJ203, WJ373 (ΔmepS), WJ374 (ΔmepM), and WJ309 (ΔmepS ΔmepM), were grown overnight in M9 glucose medium lacking casamino acids. The cultures were washed and diluted in LB to an OD600 of 0.05. Cells were then grown with agitation at 30°C and harvested around an OD600 of 0.5. Equivalent amounts of whole-cell lysates of each strain were used for immunoblotting with anti-FLAG and anti-RpoA antibodies. Shown are the representative images from triplicate experiments. (D) The band intensities of the Western blot in (C) were quantified using ImageJ software and the relative MepH-Flag levels are shown after normalization with RpoA signals. Error bars represent the standard deviation from triplicate measurements.

