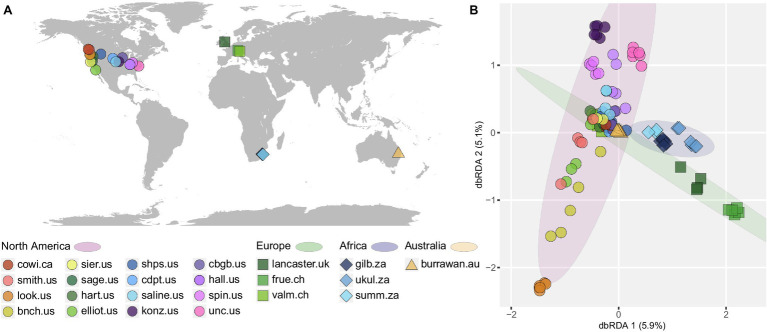
Figure 1.
(A) Global distribution of all studied temperate grassland soils, (B) distance-based redundancy analysis (dbRDA) displaying the effect of study sites on the Bray–Curtis dissimilarity of diazotrophic communities. Each color represents one collection site. Only samples from non-addition plots were used here. Shapes denote the respective continent and ellipses encompass sites from the same continent. More information on sampling sites and their geographic locations can be found in Supplementary Table S1.

