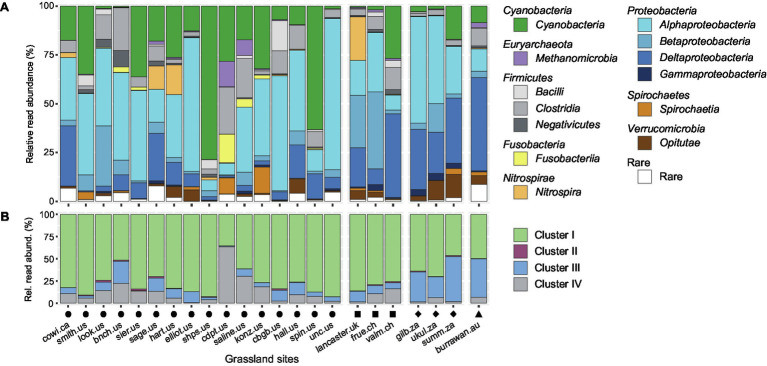
Figure 2.
Diazotrophic community composition per grassland site. (A) Taxonomic affiliation of OTUs summarized at the class level based on BLASTP analysis; (B) relative read abundances of phylogenetic nifH clusters based on classification and regression trees (CART) analysis. On the x-axis, every bar represents the average community per study site, sorted according to longitudinal coordinates, whereas the y-axis shows the relative read abundance of taxonomic classes (A) or phylogenetic nifH clusters (B). Shapes above the grassland site names denote the respective continent (circle: North America, square: Europe, diamond: Africa, triangle: Australia).

