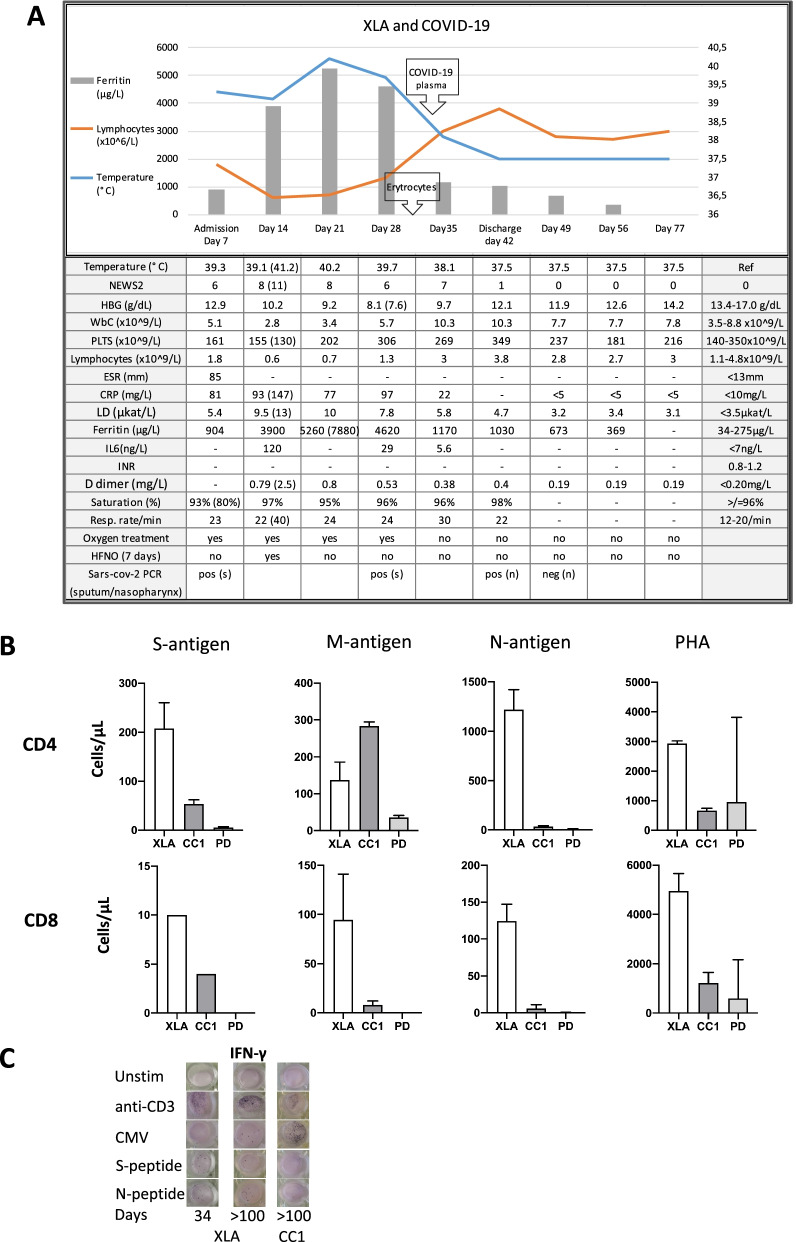
Fig. 2.
Summary of clinical and laboratory parameters during hospitalization and SARS-CoV-2 specific T cell responses. A Trajectory of clinical parameters during and post hospitalization of the patient. The arrows indicate time of transfusion of red cell concentrates and convalescent plasma therapy. Values in parentheses show the highest/lowest value during the period of hospitalization. NEWS2, National Early Warning Score; HFNO, High Flow Nasal Oxygen. B Quantification of proliferating T-cells in whole blood stimulated with specific SARS-CoV-2 peptides [spike (S), membrane (M) and nucleocapsid (N)] and the mitogen phytohemagglutinin (PHA). Medians and range of 2 experiments in XLA patient, convalescent control (CC), and 5 plasma donors (PD) are shown. C ELISpot showing IFN-γ-producing cells after stimulation with anti-CD3, CMV peptides and SARS-CoV-2 spike (S) and nucleocapsid (N) peptides

