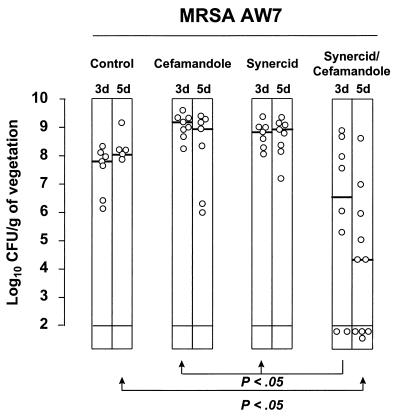
FIG. 4.
Treatment of experimental endocarditis due to MRSA AW7 with Q-D (Synercid) and cefamandole used alone or in combination. Each dot indicates the bacterial density in the vegetations of independent animals. The horizontal bars in the columns indicate the median values for the group. Treatment groups and treatment duration are indicated at the top of the graph. Control animals were killed at treatment onset, i.e., 12 h after inoculation, in order to determine the frequency and severity of valve infection. Treatment duration was either 3 days (3 d) or 5 days (5 d). A P value of <0.05 indicates that the difference between the groups was statistically significant.

