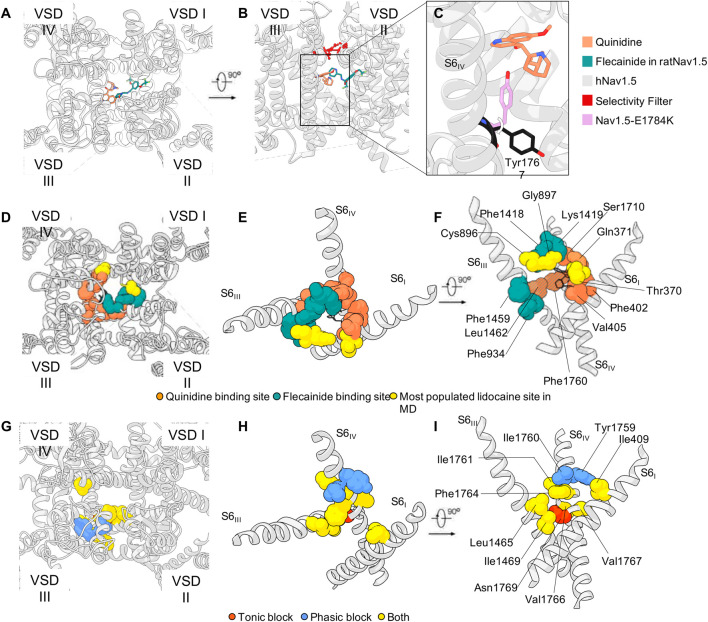
FIGURE 5.
LAs binding sites. (A,B) Quinidine in hNav1.5 and flecainide binding poses in rNav1.5 (PDB IDs: 6LQA and 6UZ0, respectively) and (C) quinidine’s effect on the rotation Tyr1767, as observed in hNav1.5 (PDB ID: 7DTC). (D–F) Sphere representation of the residues that appear in the binding site of quinidine (black wires) [in PDB ID: 6LQA (Li et al., 2021a)], and the corresponding hNav1.5 residues that were additionally observed in the binding pose of flecainide [PDB ID: 6UZ0 (Jiang et al., 2020)], and the lidocaine molecules simulated in (Nguyen et al., 2019). The overlapping residues are colored in stripes in Panel F. (G–I) Rat Nav1.2 homology model (https://alphafold.ebi.ac.uk/entry/P04775) and sphere representation of the residues characterized in mutagenesis experiments (Ragsdale et al., 1994; Yarov-Yarovoy et al., 2002). Panels D-F and G-I show a partial overlapping of the binding regions of quinidine on hNav1.5 and lidocaine on rNav1.2, respectively.

