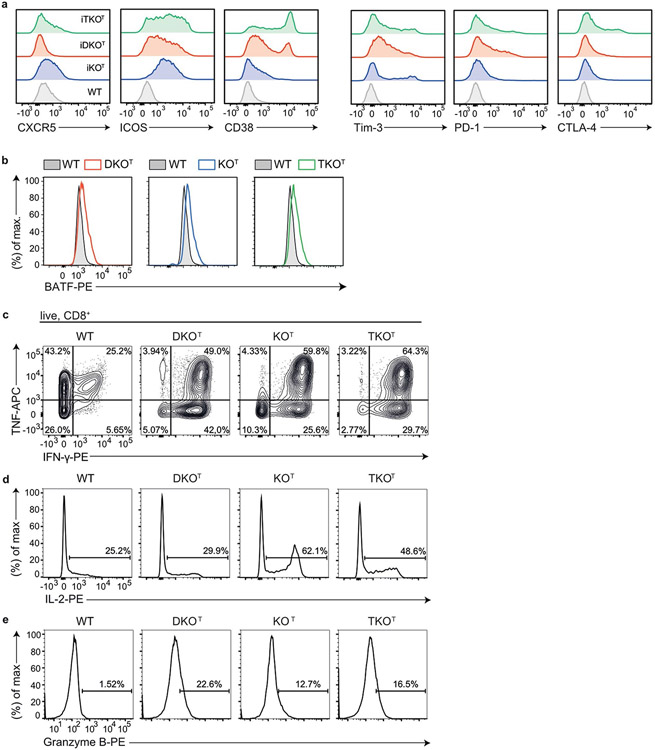
Extended Data Fig. 3 ∣. Describing phenotypes of DKOT, KOT and TKOT CD8+ T cells.
Flow cytometry analysis of markers of activation and exhaustion (a) and BATF transcription factor expression (b) in splenic WT, DKOT, KOT and TKOT CD8+ T cells. Data are representative of at least 5 individual 6-12 week old mice per genotype in at least two independent experiments. Flow cytometry analysis to Fig. 3e, f: intracellular cytokine staining of IFN-γ, TNF (c) and IL-2 (d) after PMA/ionomycin stimulation in CD8+ T cells of splenocytes from WT, DKOT, KOT and TKOT mice for 4 h. Histogram analysis to Fig. 3g: Granzyme B expression in splenic WT, DKOT, KOT and TKOT CD8+ T cells (e).

