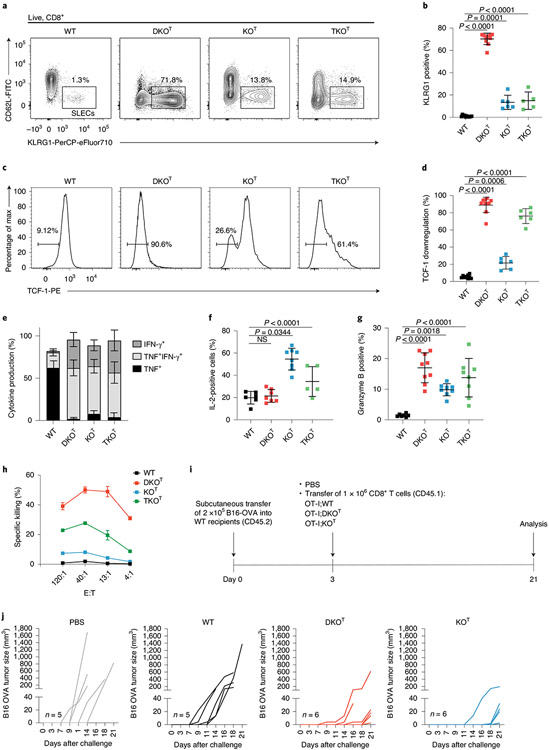
Fig. 3 ∣. Inactivation of Roquin-1/2 or Regnase-1 in CD8+ T cells enhances cytotoxicity.
a–d, Flow cytometry analysis of splenic WT, DKOT, KOT and TKOT CD8+ T cells for KLRG1 and CD62L expression (a), frequencies of SLEC CD8+ T cells (WT, n = 11; iDKO, n = 10; iKO, n = 6; iTKO, n = 5 individual mice in three independent experiments) (b) and percentage of cells with TCF-1 downregulation (WT, n = 9; iDKO, n = 10; iKO, n = 6; iTKO, n = 6 individual mice in three independent experiments) (c,d). e,f, Quantification of intracellular cytokine staining of IFN-γ, TNF (WT, n = 9; iDKO, n = 9; iKO, n = 11; iTKO, n = 5 individual mice in three independent experiments) (e) and IL-2 (WT, n = 6; iDKO, n = 7; iKO, n = 8; iTKO, n = 5 individual mice in three independent experiments) (f) in CD8+ T cells after PMA/ionomycin stimulation for 4 h. NS, not significant. g, Quantification of granzyme B-positive CD8+ T cells (WT, n = 7; iDKO, n = 11; iKO, n = 8; iTKO, n = 9 individual mice in four independent experiments) in spleens from WT, DKOT, KOT and TKOT mice. h, Chromium-release assay of P815 cells cultivated in effector to target ratios as indicated 4 h after adding splenic CD8+ T cells isolated from WT, DKOT, KOT and TKOT mice (n = 2 individual mice in one experiment). i, Schematic representation of the experimental set-up of the B16-OVA tumor model. j, B16-OVA tumor growth without transfer (PBS control n = 5) or after transfer of either WT (n = 5), DKOT or KOT OT-I T cells (n = 6 individual mice in one experiment). Data are presented as mean ± s.e.m. Statistical significance was calculated by one-way ANOVA with Dunnett’s post hoc test.

