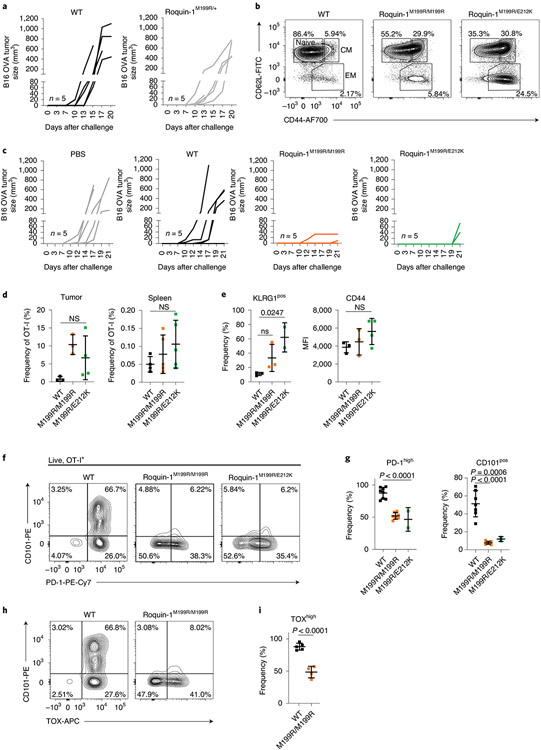
Fig. 8 ∣. Disrupting Roquin-1 interaction with Regnase-1 improves effector function of tumor-specific T cells.
a,c, Analysis of tumor growth of B16-OVA after transfer of OT-I T cells as described in Fig. 3i and with the indicated genotypes (n = 5 individual mice in one experiment, respectively). b, Flow cytometry analysis of activation markers CD44 and CD62L on OT-I T cells before transfer. d, Frequencies of OT-I T cells relative to all + cells are displayed for tumor and spleen at day 21 after tumor cell transfer. e–i, Flow cytometry analysis of KLRG-1, CD44, CD101, PD-1 and TOX on OT-I T cells in the tumor on day 21 after tumor cell transfer. Data are representative of WT, n = 4; M199R/M199R, n = 5; M199R/E212K, n = 5 individual mice analyzed in one experiment (d). Data are representative of WT, n = 3; M199R/M199R, n = 3; M199R/E212K, n = 2 or 4 each individual mice analyzed in one experiment (e). Data are representative of WT, n = 7; M199R/M199R, n = 7; M199R/E212K, n = 2 individual mice in three independent experiments (g). Data are representative of WT, n = 5 and M199R/M199R, n = 4 individual mice in two independent experiments (h). Data are presented as mean ± s.e.m. Statistical significance was calculated by one-way ANOVA with Bonferroni post hoc test (d,e,g) or unpaired one-tailed Student’s t-test (i).

