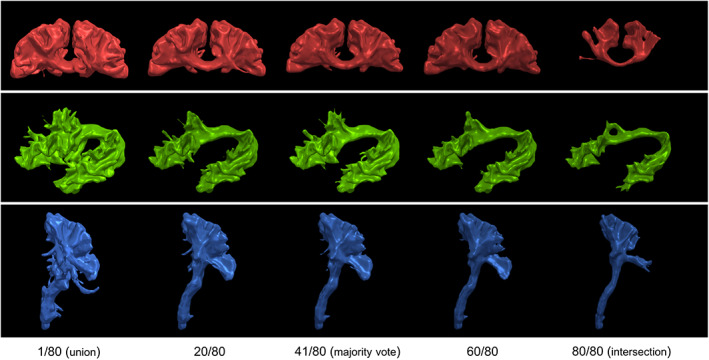
FIGURE 2.

Example of gold‐standard generation obtained by using a voting approach. Each row shows the bundles of interest and represents a smooth isosurface at the selected threshold. From left to right, multiple voting ratios from 0.0125 (union) to 0.5125 (majority vote) to 1.0 (intersection) from 80 segmentations of the first subject. At each increase in the voting threshold, the number of voxels decreases. A minimal vote set at 1 out of 80 (1/80 or 0.0125; left) is equivalent to a union of all segmentations while a vote set at 80 out of 80 (right) is equivalent to an intersection between all segmentations. Both of these thresholds are prone to variations due to outliers in the submitted data. Thresholds at 25, 50, and 75% generate similar group averages due to the raters' high spatial consistency, a majority‐vote approach was selected for its intuitiveness and coherence with the first Tractostorm project
