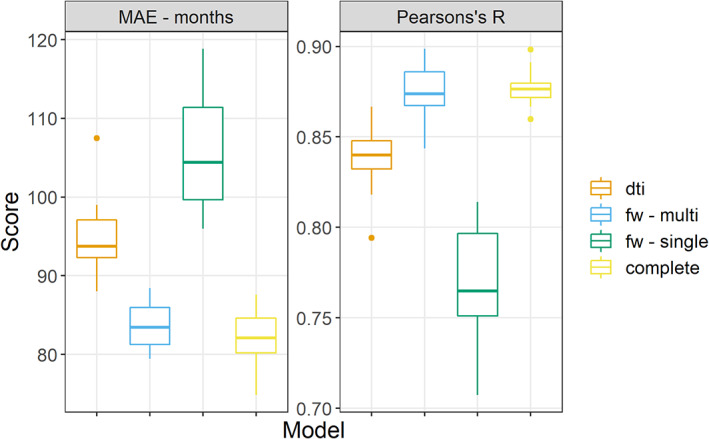
FIGURE 3.

Comparison of performance. This figure reports the performance for all the repetitions of the different models, measured as Pearson correlation between predicted and actual age and mean absolute error (MAE) between predicted and actual age in months on the Y axis
