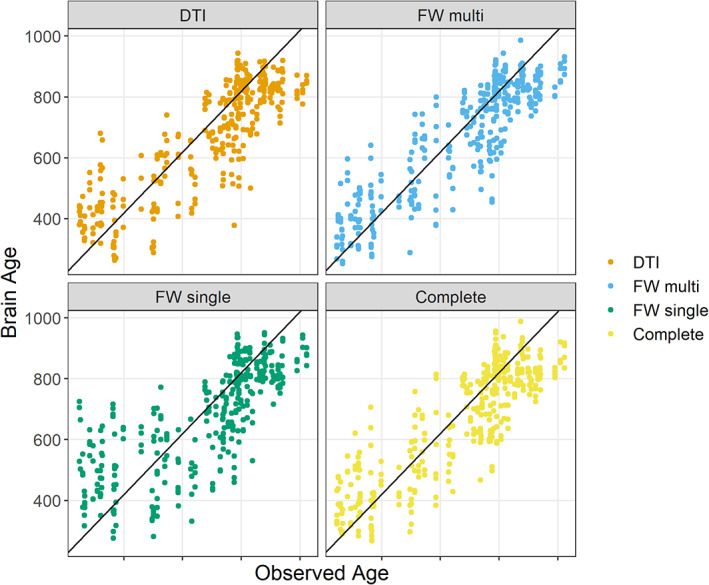
FIGURE 4.

Scatterplots of brain age and observed age. The figure reports the predictions obtained by the leave‐one‐out cross‐validations together with the observed age of the subjects. The black lines represent the identity line. The complete sets of scatterplots from the 10 repetitions of the 10‐folds cross‐validations is presented as Figure S5
