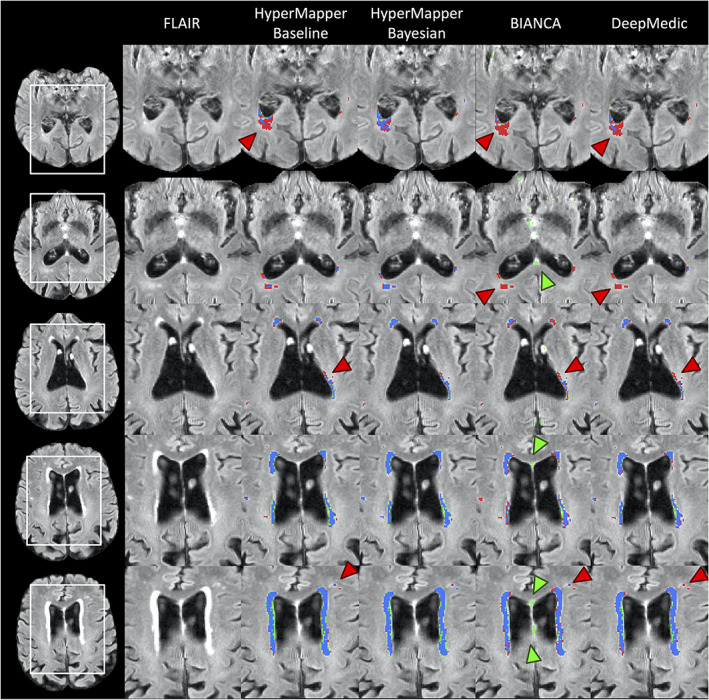
FIGURE 4.

Visual comparison of the tested methods in an example subject. Blue represents the overlap between ground truth and prediction (true‐positive voxels), red (and red arrows) represents ground truth voxels missing in prediction (false‐negative voxels), green (and green arrows) represents prediction voxels not in ground truth (false‐positive voxels)
