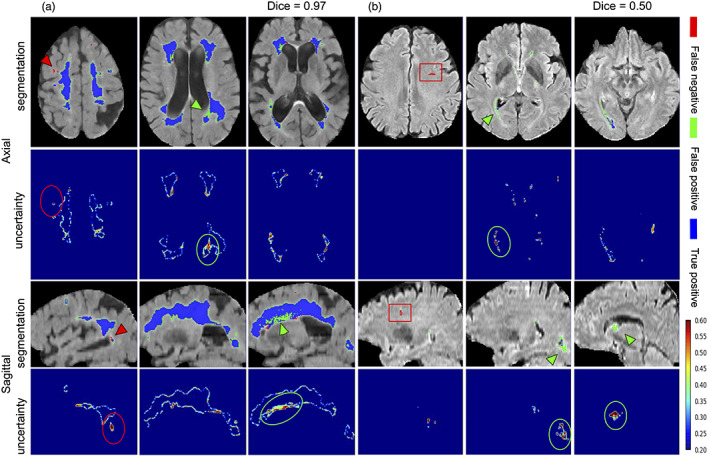
FIGURE 5.

WMH segmentation and uncertainty maps of cases with the highest (a) and lowest (b) Dice similarity coefficients from the test set. Red arrowheads and circles highlight areas of under‐segmented and green arrowheads and circles highlight areas that were over‐segmented. Red boxes represent an enlarged perivascular space (PVS) in the frontal lobe that was mislabelled as WMH in the ground truth data, but accurately not captured by our model as WMH. WMH, white matter hyperintensity
