
Fig. 2.
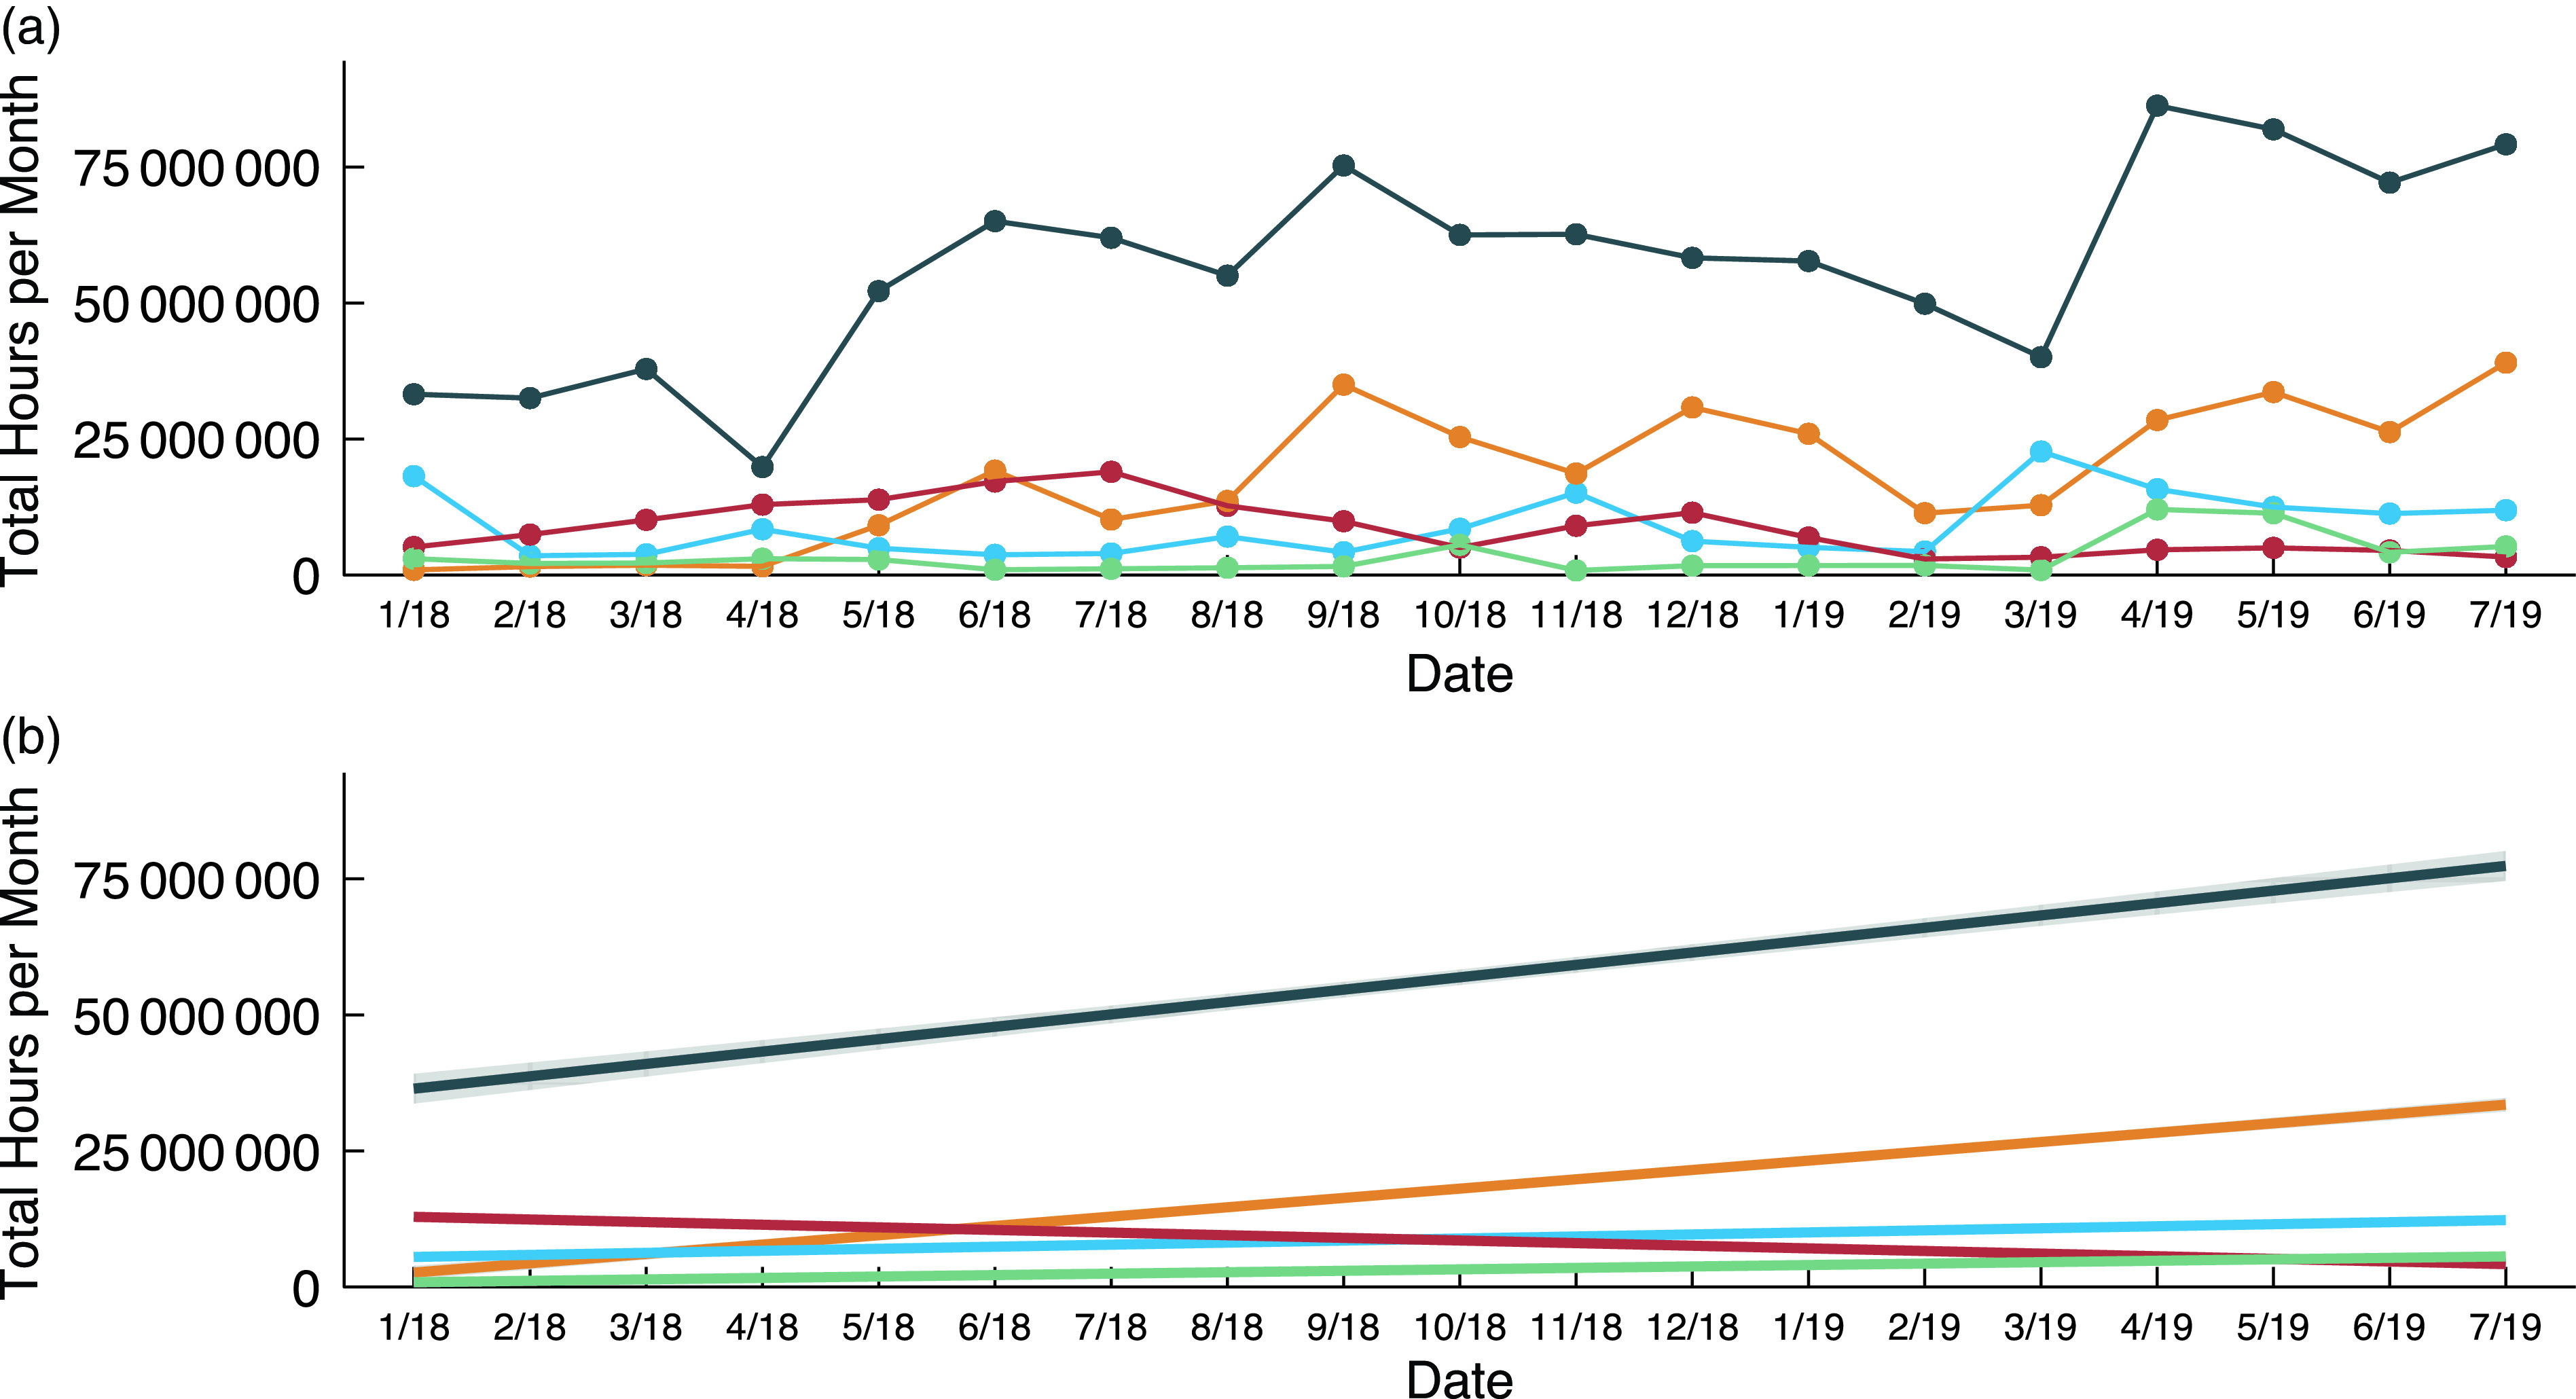
Longitudinal trends in viewership of product categories across Twitch streamer profiles. Total hours of viewership from streamer profiles across all brands searched within the five categories of interest. (A) Raw counts of hours of exposure per month, summed over all brands searched for that category. (B) Trend lines for each category (note that these bands are not shown in some lines as a result of the figure scale). Energy drinks (P < 0·001), restaurants and food delivery services (P < 0·001), and candies (P = 0·049) all experienced a significant increase in exposure over time, while sodas and other sugar-sweetened beverages had a significant decrease over time (P = 0·012). Processed snack exposure did not significantly change (P = 0·116)