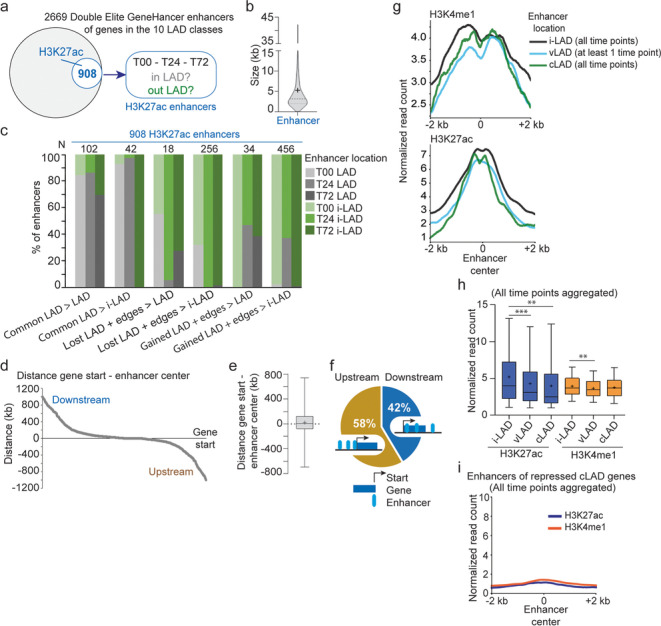
Fig. 8.

Co-segregation of enhancers with target genes in vLADs or cLADs. a Identification of H3K27ac enhancers used in this study. b Size distribution of the GeneHancer double-elite enhancers considered in this study; thick bar, median; thin bars, 25–75% percentile; cross, mean. c Proportions of H3K27ac enhancers in LADs (gray shades) or i-LADs (green shades) at T00, T24, and T72, which are targeted to genes localized in indicated LAD classes (x axis); see Additional file 2, Table S7 for numbers of enhancers localized in each LAD class. d Distribution of gene start-enhancer distances for enhancers targeted to DE genes in all LAD classes; distances are from enhancer center to gene start sites, upstream (negative values) or downstream (positive values) of the gene start sites. e Box plot of gene start-enhancer center distances; bar, median; cross, mean; box, 25–75% percentile; whiskers, min-max. f Proportions of upstream and downstream enhancers. g H3K4me1 and H3K27ac levels at enhancers located in i-LADs, vLADs, and cLADs (all time points aggregated). vLAD enhancers are defined as enhancers in a vLAD at ≥ 1 time point in the 0–72-h time course; cLAD enhancers are in cLADs at all time points; i-LAD enhancers are in i-LADs at all time points; mean ChIP-seq read counts normalized to library size across all time points. h H3K27ac and H3K4me1 levels at enhancers in i-LADs, vLADs, and cLADs (all time points aggregated); bar, median; cross, mean; box, 25–75% percentile; whiskers, min-max. H3K27ac **P = 0.0049, ***P = 0.0002; H3K4me1 **P = 0.0023; unpaired two-tailed t-tests with Welch’s correction. i H3K27ac and H3K4me1 levels at enhancers of repressed cLAD genes (all time points aggregated)
