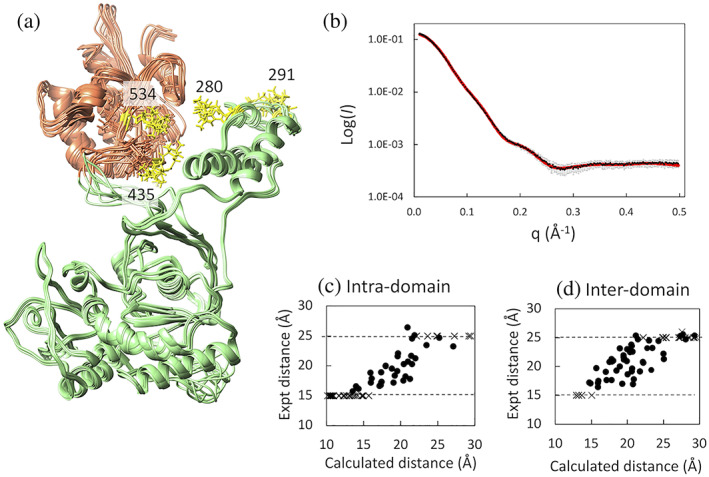
FIGURE 3.

(a) Overview of the 10 energy‐minimized structures of p66L289Ktr, optimized with SAXS and NMR PRE data, (b) plots of experimental (black) and calculated (red) SAXS intensity curves for p66L289Ktr, agreeing with the experimental data at the normalized χ2, 0.35, and comparison of MTSL‐proton distances in the best‐energy minimized structure with those experimentally obtained from PRE, for (c) intra‐domain and (d) inter‐domain residues in p66L289K. In panel (a), the RNH domain is shown by light orange, p51 domain is shown by light green, and MTSL‐tags at residues 280, 291, 435, and 534, with three different orientations for each, are shown by yellow sticks. In panels (c) and (d), distances directly obtained from experimental PREs are shown by black spheres within upper (25 Å) and lower (15 Å) boundaries. Distances above or below the boundaries are shown by cross marks
