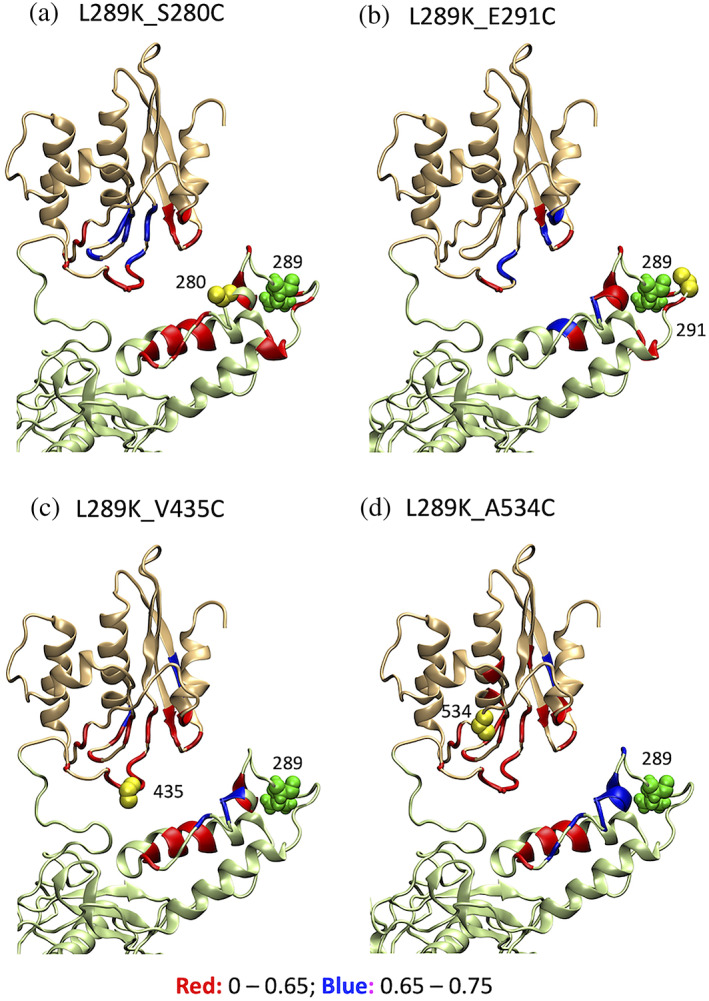
FIGURE 4.

Visual presentation of the PRE effect from MTSL‐tags (yellow spheres) at residues (a) 280, (b) 291, (c) 435, and (d) 534 in p66L289K on the energy‐minimized structure. In each panel, thumb and RNH domains are shown by light green and light orange colors, respectively; residue 289 location is shown by green spheres; I para /I dia less than 0.65, that is, stronger PRE effect, is shown in red ribbon and 0.65–0.75, weaker PRE effect, by blue ribbons
