
FIGURE 5.
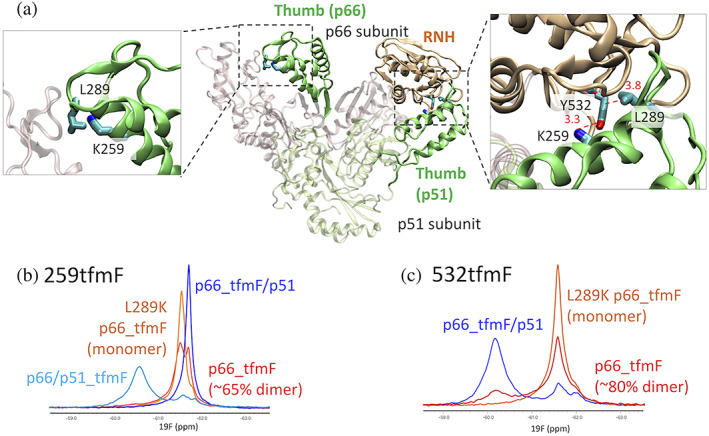
(a) Highlight of the K259 and Y532, sites labeled with tfmF for 19F NMR, on p66/p51 structure and 19F NMR spectra of (b) 259tfmF and (c) 532tfmF, recorded at 298 K. In (b), the spectra are shown for p66/p51259tfmF (light blue), p66259tfmF/L289K (orange), p66259tfmF (red), and p66259tfmF/p51 (blue). In (c), the spectra are shown for p66532tfmF/L289K (orange), p66532tfmF (red), and p66532tfmF/p51 (blue). In these panels, subscript notations were avoided for readability