
FIGURE 6.
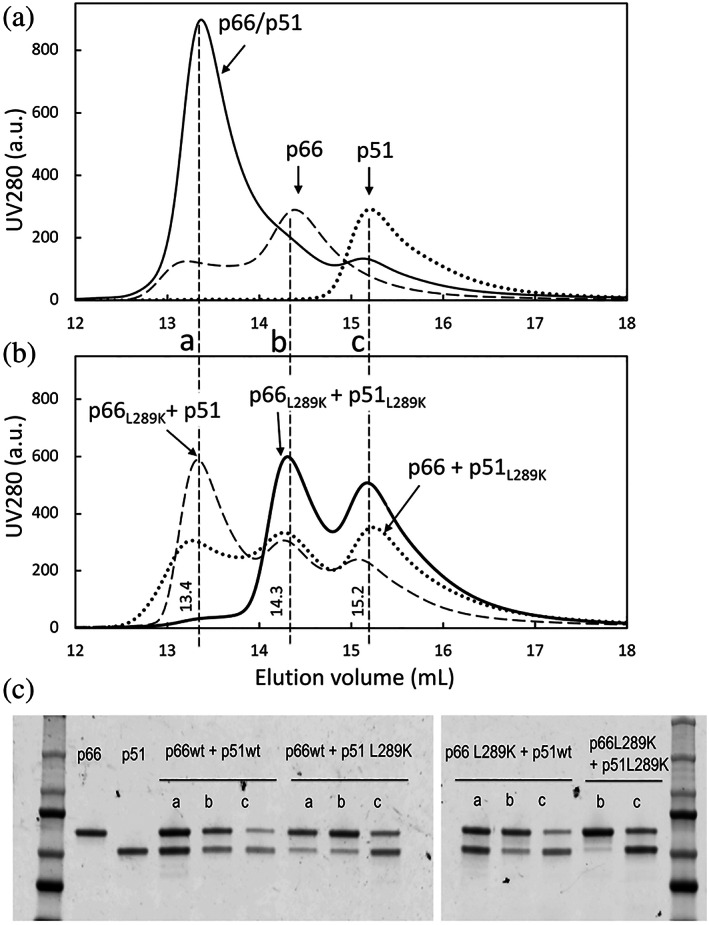
SEC elution profiles of (a) p66/p51 (solid line), p51 (dotted line) and p66 (dashed line), and of (b) p66L289K and p51L289K mixture (solid line), p66 and p51L289K mixture (dotted line), and p66L289K and p51 mixture (dashed line), and (c), SDS‐PAGE of the corresponding peaks. In panel (a) below, the fractions analyzed by SDS‐PAGE are marked with a (at ~13.4 ml), b (at ~14.3 ml), and c (at 15.2 ml). In panel (c), from left to right are: a marker ladder, p66 control, p51 control, and samples from the a, b, or c elution positions, as indicated, for p66/p51, p66 and p51L289K mixture, p66L289K and p51 mixture, and p66L289K and p51L289K mixture, with the ladder for the second PAGE in the last lane