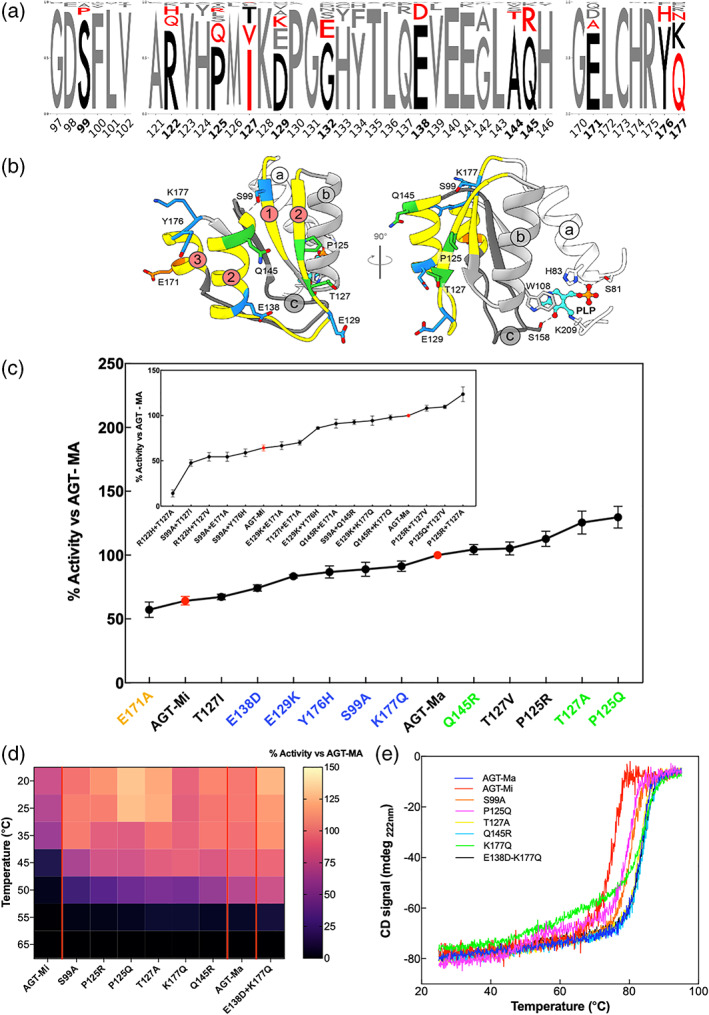
FIGURE 3.

Library construction and biochemical and biophysical characterization of the variants. (a) Consensus logo of the three frustrated regions under study. The sequences (110–130) from the non‐redundant database were collected by blast search and aligned using MUSCLE algorithm on Jalview. 40 The logo was generated using Logo maker (https://logomaker.readthedocs.io/en/latest/). In bold black numbers, the positions that were mutated. In black, the amino acids of the human AGT1 sequence, while in red, the amino acids considered for the library. (b) The mutated residues are plotted over the AGT‐Ma structures in different colors. In orange those with activity below AGT‐Mi, in blue those with activity between AGT‐Mi and AGT‐Ma, and in green those above AGT‐Ma. (c) Residual activity of the indicated single variants as compared to AGT‐Ma. Inset panel C) Residual activity of the indicated double variants as compared to AGT‐Ma. Experiments have been performed in duplicate, and for each single experiments, three technical triplicates have been used. Data are represented as mean values ± SD. (d) Heat map of residual activity of selected mutants obtained after incubating the lysate at different temperatures for 10 min. The color code is the same of panel c. (e) Thermal stability curves of the selected variants represented in panel d. Color code is the same of panel c. Experiments have been performed in duplicate, and for each single experiment, three technical replicates have been used
