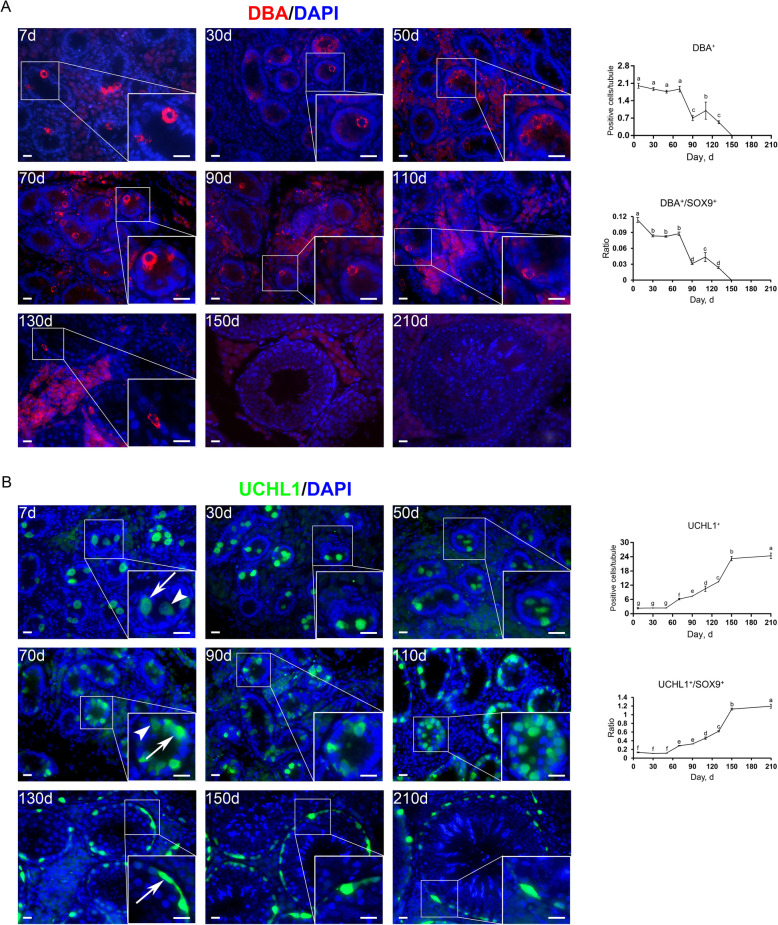
Fig. 5.
Immunostaining and quantification of DBA+ or UCHL1+ cells in porcine testis sections. A Left: DBA immunostaining of porcine testis sections at each age. Bar = 10 μm. Right: the numbers of DBA+ cells (upper) and the ratios of DBA+ to SOX9+ cells (lower) per cross-section of seminiferous cords/tubules in porcine testes at each age. B Left: UCHL1 immunostaining of porcine testis sections at each age. Arrows and arrowheads point to UCHL1high and UCHL1low cells, respectively. Bar = 10 μm. Right: the numbers of UCHL1+ cells (upper) and the ratios of UCHL1+ to SOX9+ cells (lower) per cross-section of seminiferous cords/tubules in porcine testes at each age. Data are presented as the mean ± SEM of three littermates, with 50 round cord/tubule cross-sections analyzed per individual. Different letters indicate significant differences between groups (P < 0.05)

