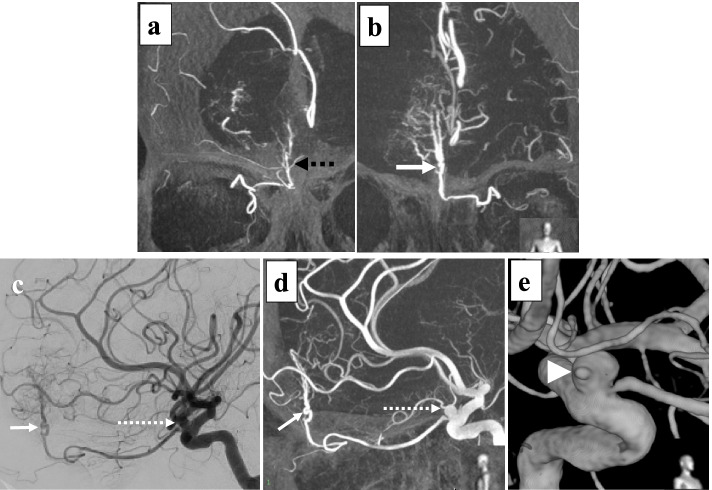
Fig. 2.
Digital subtraction angiography (DSA) of internal carotid artery (ICA). a Coronal view of Maximum Intensity Projection (MIP) image shows ipsilateral, right tumor feeder (black dotted arrow). b MIP image shows contralateral, left tumor feeding artery (white arrow). c Lateral view of DSA of left ICA shows left tumor feeder (white arrow) arose from left ophthalmic artery (OphA) and left ICA-OphA aneurysm (dotted line arrow). d Lateral view of MIP image shows that left feeding artery (white arrow) and ICA-OphA aneurysm (dotted line arrow). e 3D-reconstruction view demonstrates a bleb formation (white arrowhead) in ICA-OphA aneurysm wall

