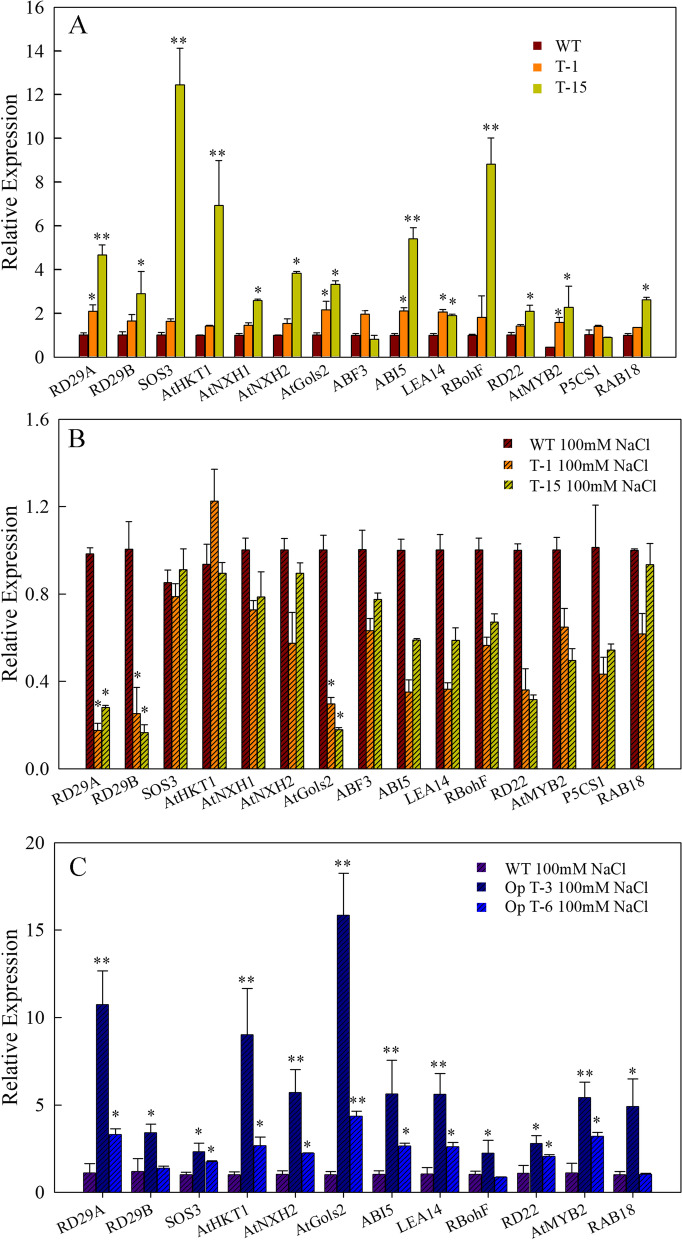
Fig. 6.
Relative expression levels of stress responsive marker genes and salinity responsive genes in WT and transgenic lines under normal conditions and after treatment with NaCl. a Relative expression levels of 15 genes in the WT and transgenic lines T-1 and T-15 under normal conditions. b Relative expression levels of 15 genes in the WT and transgenic lines T-1 and T-15 treated with 200 mM NaCl for 24 h. c Relative expression levels of 12 genes in the WT and transgenic lines Op T-3 and Op T-6 treated with 200 mM NaCl for 24 h. Data represent the mean ± SD of three biological replicates. *P < 0.05 and **P < 0.01 by Student’s t-test

