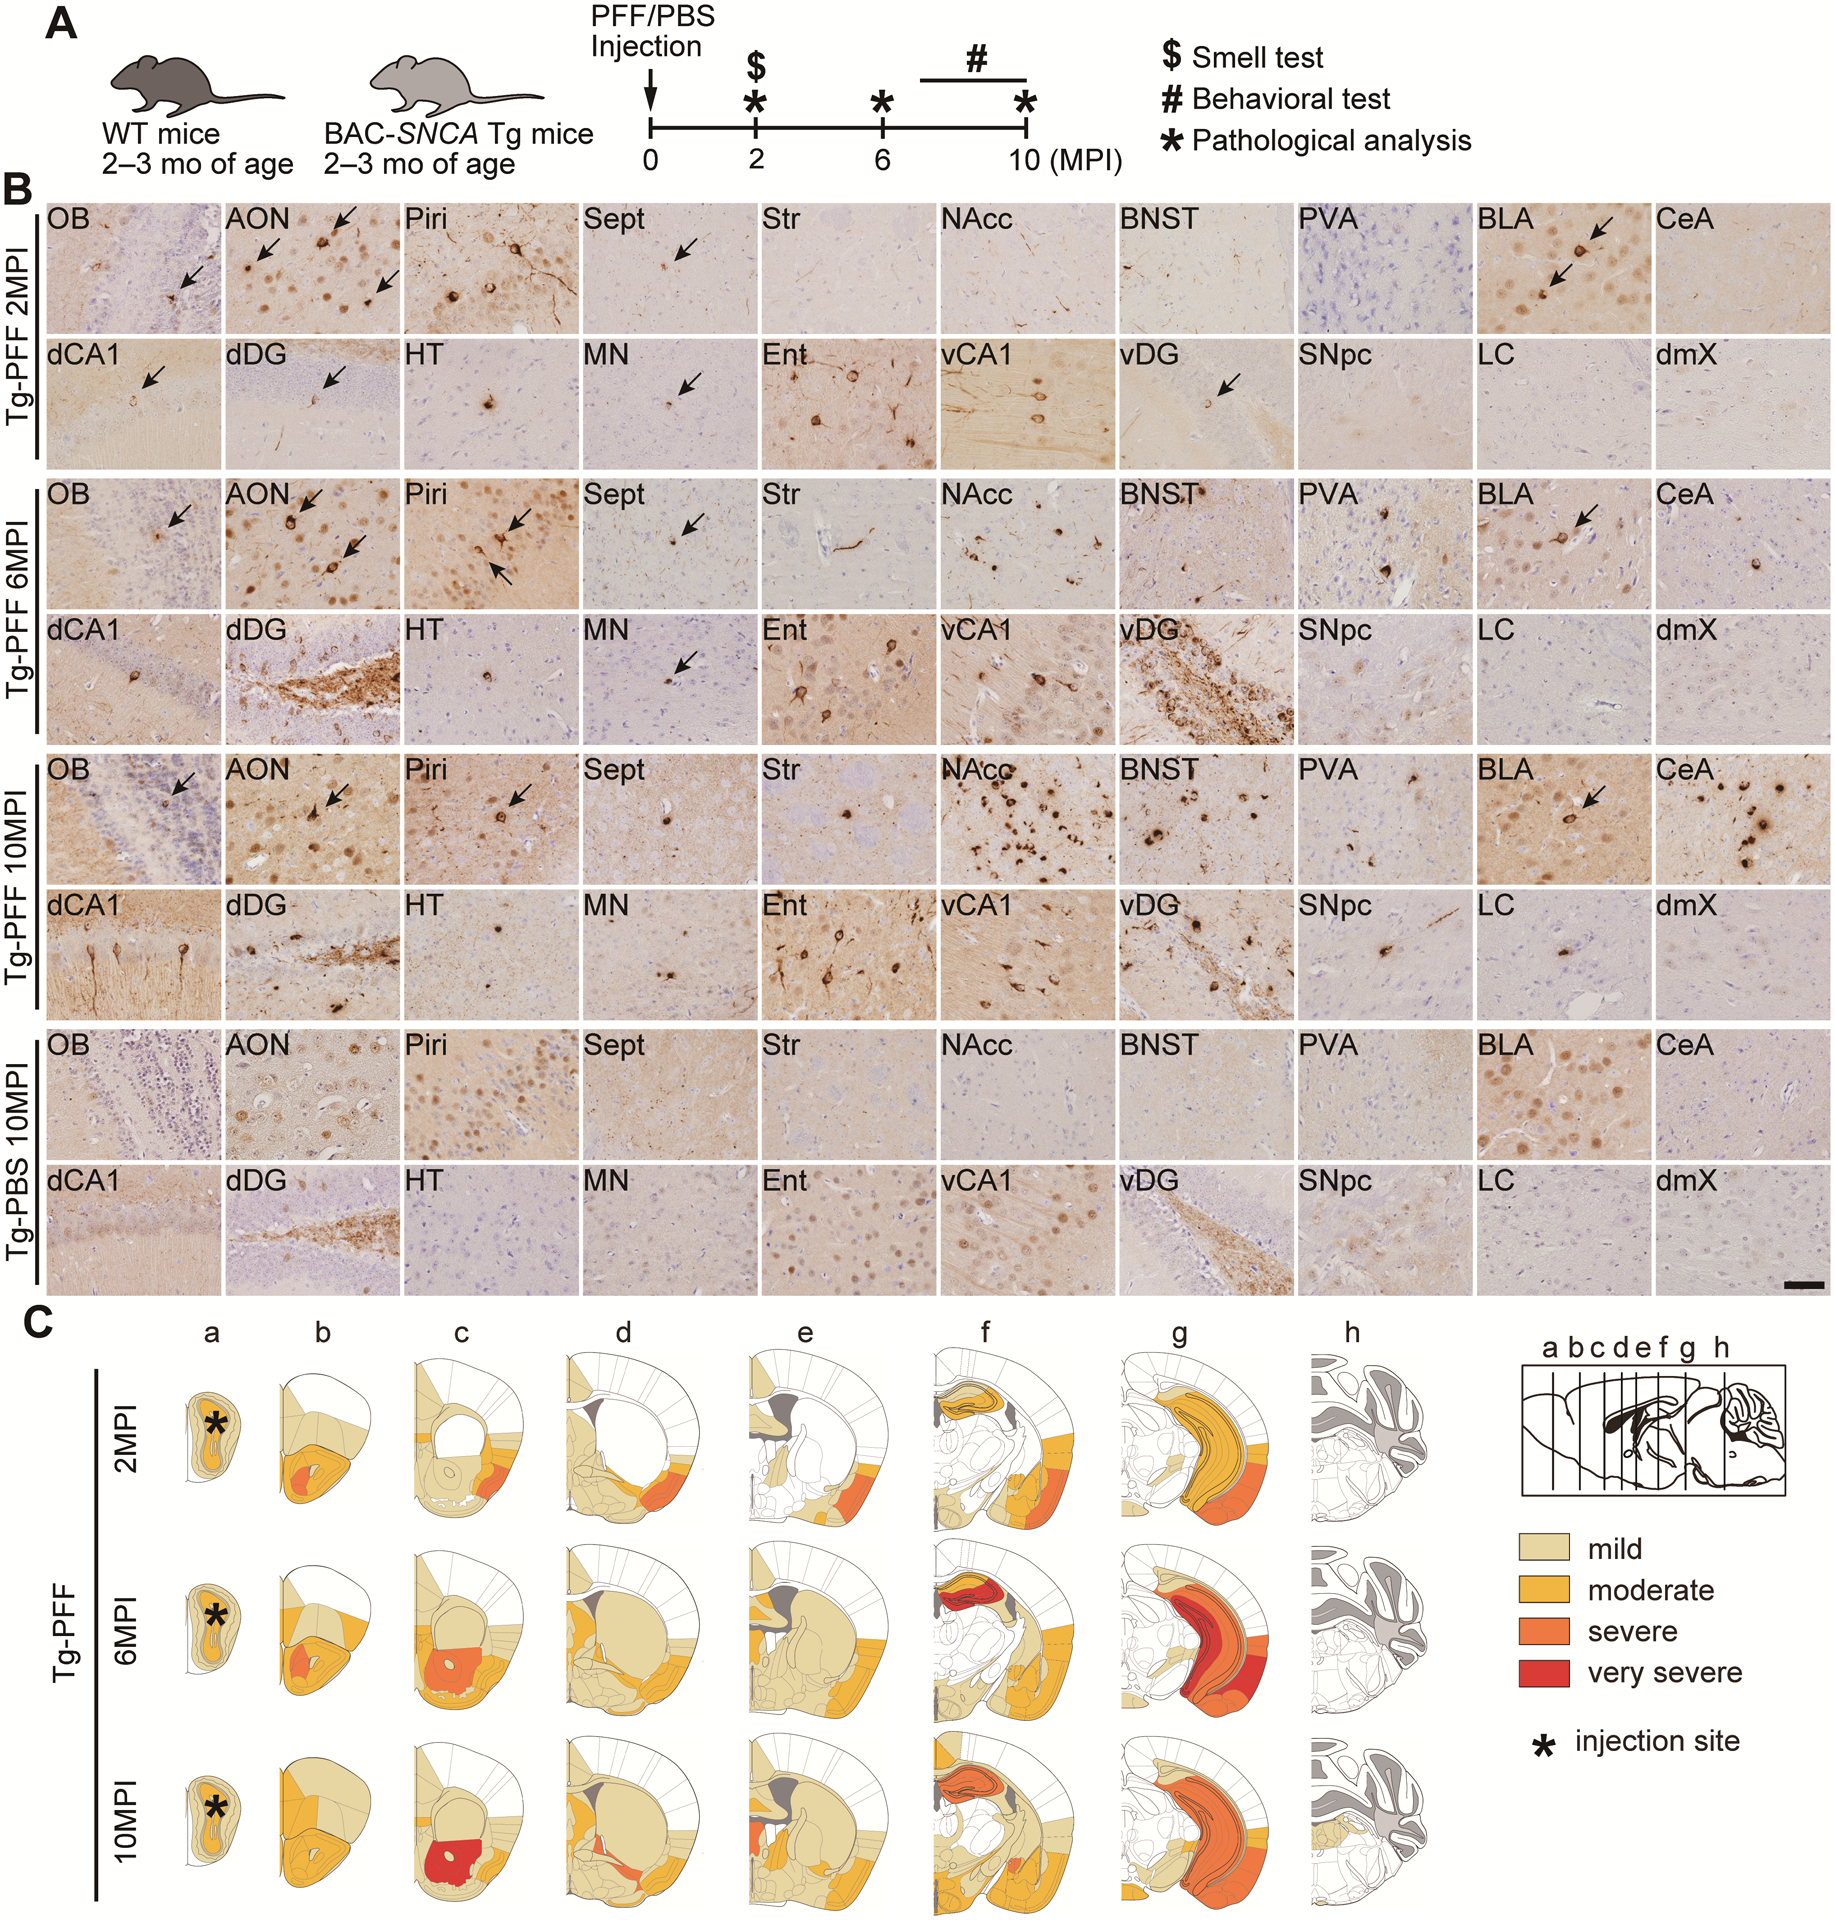
Fig. 2. Spatiotemporal distribution of α-Syn pathology in A53T BAC-SNCA Tg mice injected with α-Syn PFFs.

(A) Schematic representation of experimental design. (B) Phosphorylated α-Syn immunohistochemistry (EP1536Y) in the indicated brain regions of the Tg-PFF mice at 2, 6, and 10MPI and the Tg-PBS mice at 10MPI. Arrows indicate pSyn-positive inclusions. Sept, septal nucleus; Str, Striatum; dCA1, dorsal CA1; HT, hypothalamus; MN, mammillary nucleus. Scale bar 50 μm. (C) Heat map colors represent the extent of α-Syn pathology (light yellow, mild pathology; yellow, moderate pathology; orange, severe pathology, red; very severe pathology).
